Figures & data
Figure 1 Diagram of the fabrication process of the fluorescent CNPs.
Notes: (A) Sequential synthetic steps: (I) fluorescent labeling of the SiO2 particles (f-SiO2), and (II) deposition of CNTs onto the f-SiO2 spheres (CNP). TEM images of (B) f-SiO2 particles and (C) CNPs. Confocal microscopy image of the RBITC fluorescence on f-SiO2 particles (D) and (E) CNPs in buffered culture medium. Arrows point to individual particles in single Z-plane confocal images.
Abbreviations: CNP, CNT-bearing particle; CNTs, carbon nanotubes; f-SiO2, fluorescent-labeled silica particles; RBITC, rhodamine B isothiocyanate; TEM, transmission electron microscopy.
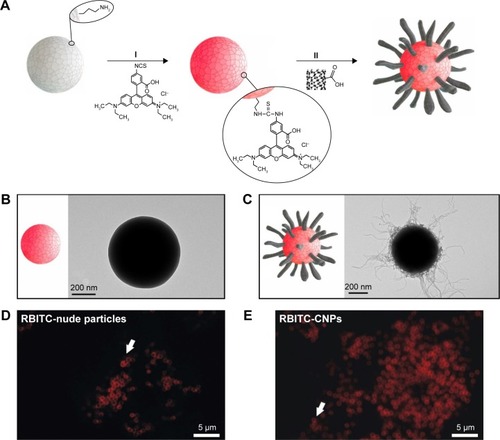
Figure 2 CNP cellular uptake and intracellular distribution.
Notes: (A) Confocal microscopy image of HeLa cells containing intracellular CNPs at 2 and 96 h. The white cross (also visible in the lateral projections) indicates the position of a cytoplasmic particle (red channel) 2 h after exposure. CNPs accumulate at the centrosomal region of the cells 96 h after initial contact (inset). (B) Confocal microscopy projection image of HeLa cells containing fluorescent CNPs displaying no abnormalities in the microtubule cytoskeleton. These tubulin nanofilaments irradiate from well-organized centrosomes (arrows). Cell nuclei (blue channel) of cells exposed to CNPs present a healthy appearance.
Abbreviations: CNP, CNT-bearing particle; CNTs, carbon nanotubes; o/n, overnight.
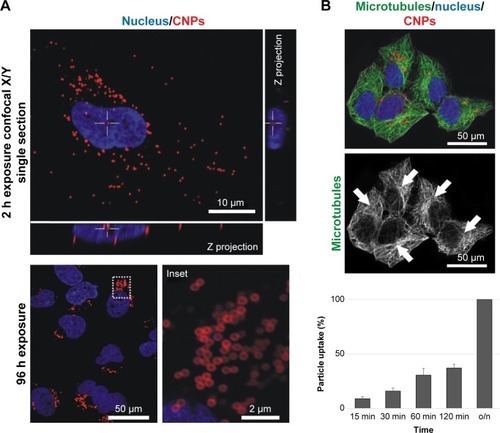
Figure 3 TEM imaging of resin section of HeLa cells exposed to CNPs.
Notes: CNP initial contact is CNT-mediated. The endocytic membranes are observed in some particles, presumably after endocytosis. Some particles also appear devoid of membranes, inside the cytoplasm. Red and blue arrows point at the CNTs attached on the surface of the CNPs and endosomal membrane, respectively. The nucleus (N) is also labeled.
Abbreviations: CNP, CNT-bearing particle; CNT, carbon nanotube; TEM, transmission electron microscopy.
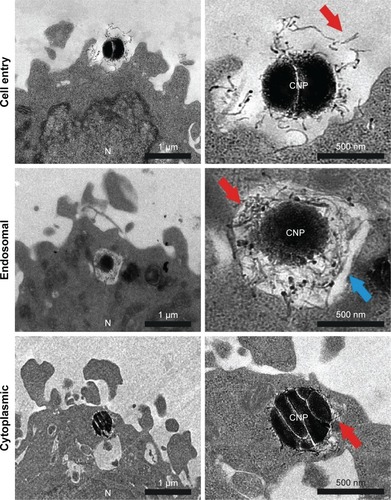
Figure 4 CNPs are highly biocompatible.
Notes: (A) Confocal microscopy images of the intracellular nanofilaments in interphase cells treated with CNPs (top) or CNTs (bottom) for 72 h. CNP-treated cells display a well-organized radial cytoskeleton with visible centrosomes (green channel, empty arrows). On the contrary, cells exposed to CNTs show a typically disorganized microtubule cytoskeleton displaying no visible centrosomes and a reactive actin cortex (red channel). (B) CNP-treated cells display a survival rate comparable to controls. (C) Control and HeLa cell cultures exposed to CNPs for 72 h. CNP-treated cells display well-assembled spindles (3, 4) compared to untreated control cells (1, 2). Dying cells were not detected.
Abbreviations: CNPs, CNT-bearing particles; CNTs, carbon nanotubes.
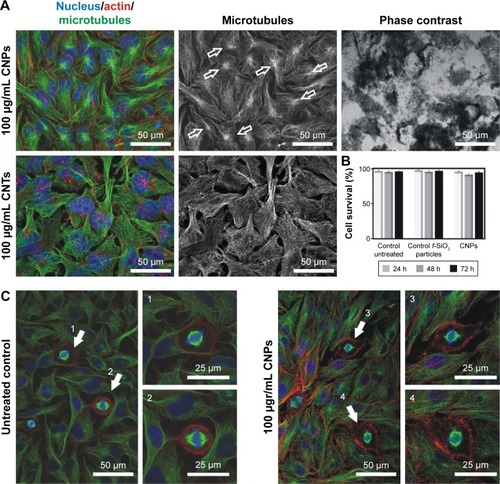
Figure 5 (A) CNPs do not interfere with cell proliferation.
Notes: Quantification of cells at the different stages of the cell proliferation cycle (G1, S, G2) using flow cytometry. CNPs display a similar cell distribution to controls (untreated and f-SiO2-treated cells). Conversely, CNT-treated cells show an obvious dose-dependent cell proliferation blockage in G2. (B) Confocal microscopy projection images of mitotic spindles in untreated controls and cells treated with 100 μg/mL attached to CNPs or dispersed (bottom). Aberrations in the organization of the spindle microtubules (red channel) are observed only in CNT-treated cells. White arrows show the centrosomal location.
Abbreviations: CNPs, CNT-bearing particles; CNT, carbon nanotube; f-SiO2, fluorescent-labeled silica particles.
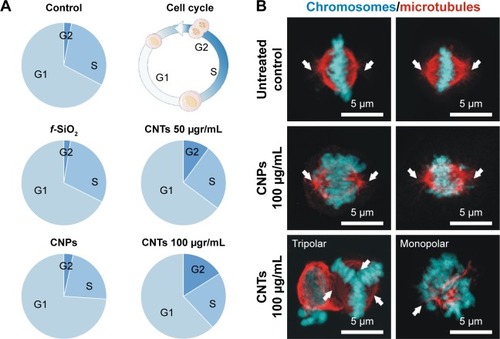
Figure 6 Depolymerization/repolymerization experiment performed in live HeLa cells containing CNPs.
Notes: (A) Confocal microscopy image of HeLa cells containing CNPs (red channel, arrows). Repolymerizing microtubules (green channel) do not nucleate at the particles. (B) Fluorescence + phase contrast microscopy on HeLa cells treated with unlabeled CNPs (arrows). The CNT coating of the particle allows particle identification in the phase contrast image. No tubulin nucleation (red channel) is observed in the surroundings of the CNPs. Asterisks indicate the location of the centrosomes. (C) Actin nucleation (green channel) is not observed in the surroundings of the CNPs (arrows).
Abbreviations: CNPs, CNT-bearing particles; CNT, carbon nanotube.
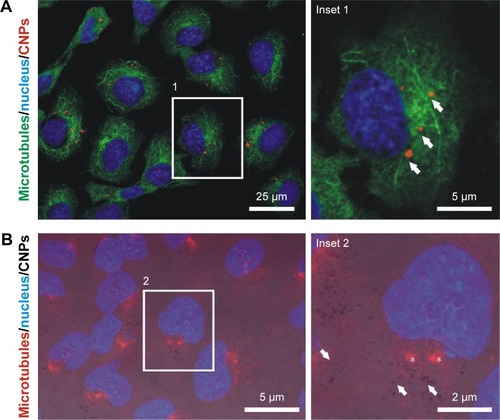
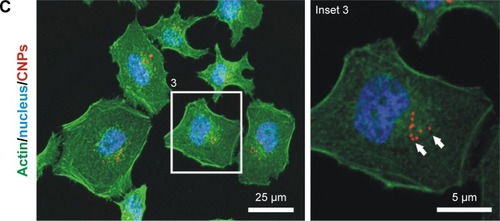
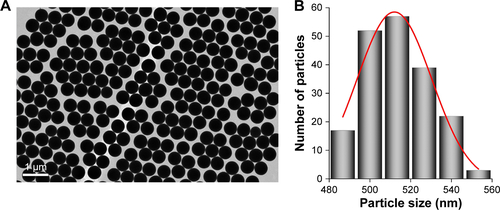
Figure S1 (A) Transmission electron microscopy image of the synthesized silica nanoparticles, and (B) histogram of particle size distribution (mean size: 512±18 nm).