Figures & data
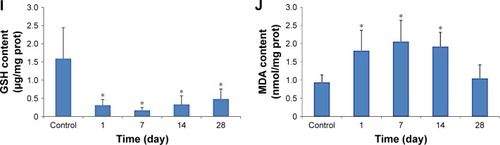
Figure 1 Characteristics of CdTe QDs: (A) AFM image; (B) absorption and emission spectra.
Notes: The average size was 3–4 nm in diameter. The maximal emission was observed at approximately 620 nm following excitation at 490 nm.
Abbreviations: AFM, atomic force microscopy; QD, quantum dot.
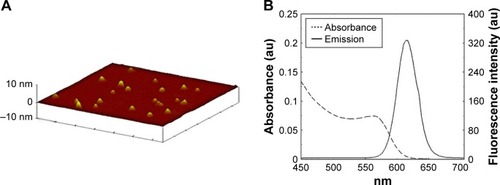
Figure 2 EPR spectra.
Notes: (A) EPR spectra of DMPO-OH adduct: (a) H2O2/Fe2+; (b) H2O2/Fe2+2 + homogenate supernatants of the liver; (c) H2O2/Fe2+ + homogenate supernatants of the kidneys. (B) EPR spectra of DMPO-OOH adduct: (a) HX/XOD; (b) HX/XOD + homogenate supernatants of the liver; (c) HX/XOD + homogenate supernatants of the kidneys. H2O2, hydrogen peroxide.
Abbreviations: DMPO, 5,5-dimethyl-1-pyrroline N-oxide; EPR, electron paramagnetic resonance; HX, xanthine; XOD, xanthine oxidase.
Figure 3 Clearance rate of ·OH and ·O2− in the liver (A) and kidneys (B) in mice exposed to 0.15, 1.5 and 15 μmol/kg CdTe QDs.
Note: The values are expressed as mean ± SD (n=6).
Abbreviations: CdTe, cadmium telluride; ·OH, hydroxyl radical; ·O2−, superoxide anion radical; QD, quantum dot.
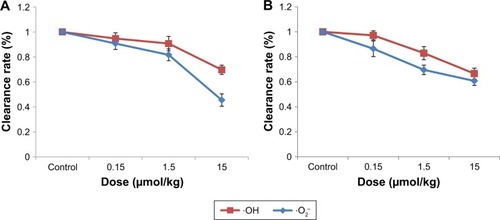
Figure 4 Oxidative stress markers of the liver (A–E) and kidneys (F–J) in mice exposed to 0.15, 1.5 and 15 μmol/kg CdTe QDs.
Notes: The values are expressed as mean ± SD (n=6). *p<0.05 vs the control group.
Abbreviations: CAT, catalase; CdTe, cadmium telluride; GPx, glutathione peroxidase; GSH, glutathione; MDA, malondialdehyde; prot, protein; QD, quantum dot; SOD, superoxide dismutase.
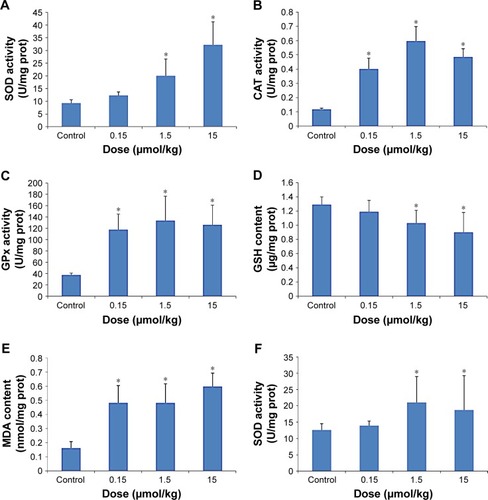
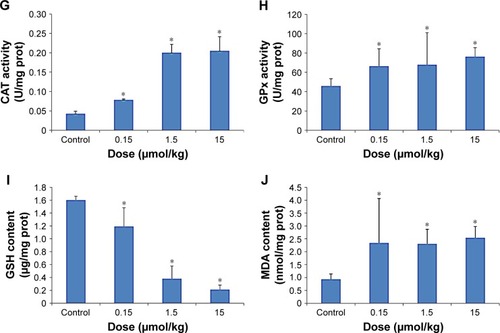
Figure 5 Clearance rate of ·OH (A) and ·O2− (B) of the liver and kidneys in mice exposed to 1.5 μmol/kg CdTe QDs for periods of up to 28 days.
Note: The values are expressed as mean ± SD (n=6).
Abbreviations: CdTe, cadmium telluride; ·OH, hydroxyl radical; ·O2−, superoxide anion radical; QD, quantum dot.
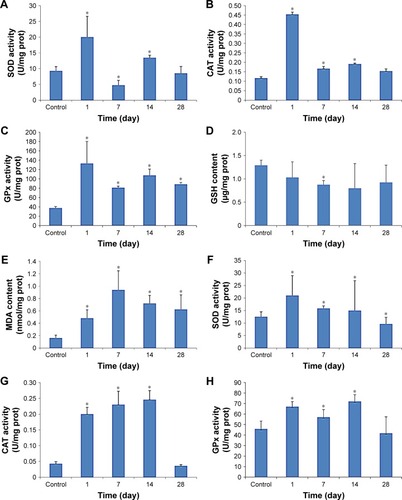
Figure 6 Oxidative stress markers of the liver (A–E) and kidneys (F–J) in mice exposed to 1.5 μmol/kg CdTe QDs for periods of up to 28 days.
Notes: The values are expressed as mean ± SD (n=6). *p<0.05 vs the control group.
Abbreviations: CdTe, cadmium telluride; CAT, catalase; GPx, glutathione peroxidase; GSH, glutathione; MDA, malondialdehyde; prot, protein; QD, quantum dot; SOD, superoxide dismutase.