Figures & data
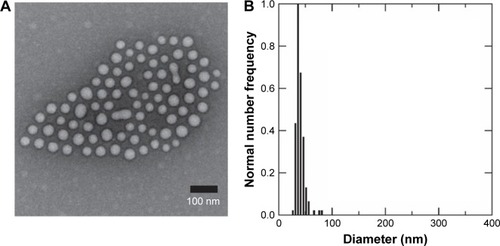
Figure 1 Size characterization of PLGA/block copolymer hybrids (PolyDots) with PLGA: PS-b-PEO wt ratio =5. (A) TEM image of PolyDot 5 sample and inset: size distribution histogram based on TEM analysis. Mean diameter (TEM) =44±9 nm. (B) DLS number diameter plot of PolyDot 5 sample. Mean hydrodynamic diameter (DLS) =48±9 nm.
Abbreviations: TEM, transmission electron microscopy; DLS, dynamic light scattering.
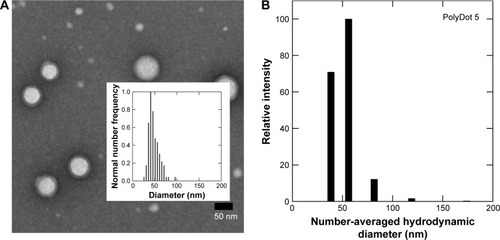
Table 1 PolyDot and control NP size properties
Figure 2 Representative TEM images of (A) control PS-b-PEO micelles, (B) PolyDot 5, (C) PolyDot 12.5, (D) PolyDot 25, and (E) PolyDot 50 samples, and (F) control PLGA nanoparticles. Scale bars =500 nm.
Abbreviations: TEM, transmission electron microscopy; PS-b-PEO, poly(styrene-b-ethylene oxide); PLGA, poly(lactic-co-glycolic acid).
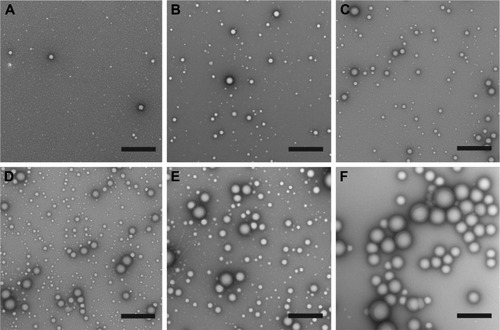
Figure 3 Size distribution histograms of (A) PS-b-PEO micelles, (B–E) PolyDots with increasing PLGA:PS-b-PEO ratio (5–50), and (F) PLGA NPs. Sample size for TEM size characterization between 100–1,000 particles.
Abbreviations: PS-b-PEO, poly(styrene-b-ethylene oxide); PLGA, poly(lactic-co-glycolic acid); NPs, nanoparticles; TEM, transmission electron microscopy.
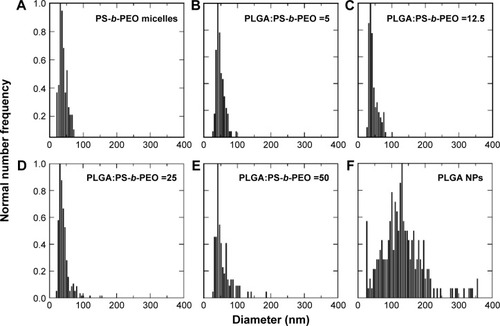
Table 2 Particle size after exposure to acidic medium
Figure 4 Average diameters and standard deviations of PS-b-PEO micelles containing no PLGA (empty), PolyDot 50 (PLGA:PS-b-PEO =50) samples, and PLGA NPs after acidification to pH 2 at 80°C. PolyDot 50 samples were synthesized at the same PS-b-PEO and PLGA concentration as empty micelle and PLGA NP samples, respectively. Bars: unfilled =0 hours; hashed =9 hours. Samples with statistically different behavior are connected by asterisks, with the p-value provided above the sample.
Abbreviations: PS-b-PEO, poly(styrene-b-ethylene oxide); PLGA, poly(lactic-co-glycolic acid); NPs, nanoparticles.
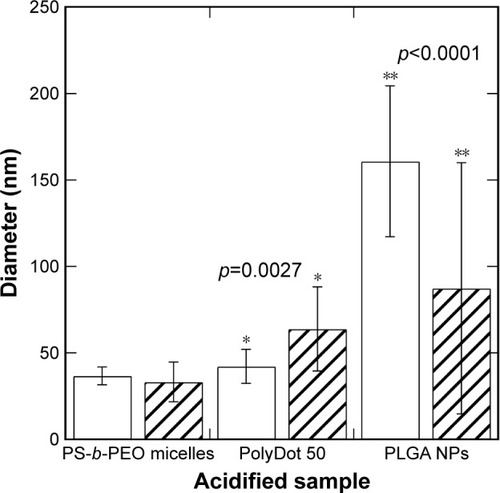
Figure 5 Proposed PolyDot structures: (A) independent populations of PLGA NPs and PS-b-PEO micelles, (B) PS-b-PEO micelles with PLGA intercalation between block copolymer chains, and (C) PS-b-PEO micelles with PLGA entrapped in the PS core.
Abbreviations: PLGA, poly(lactic-co-glycolic acid); NPs, nanoparticles; PS-b-PEO, poly(styrene-b-ethylene oxide); PS, polystyrene.
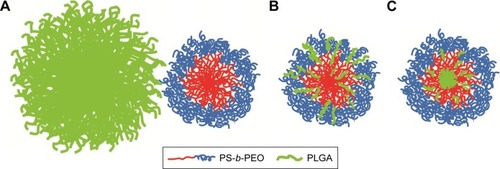
Figure 6 DEX encapsulation efficiency (DEXencapsulated/DEXadded by weight) of PS-b-PEO micelle controls, PolyDots with increasing PLGA:PS-b-PEO ratio (5, 12.5, 25, 50), and PLGA NP controls. Error bars = standard deviation from mean. All PolyDot and PLGA NP samples were statistically different from PS-b-PEO micelles (*p<0.05).
Abbreviations: DEX, dexamethasone; PS-b-PEO, poly(styrene-b-ethylene oxide); PLGA, poly(lactic-co-glycolic acid); NP, nanoparticle; ns, not significant.
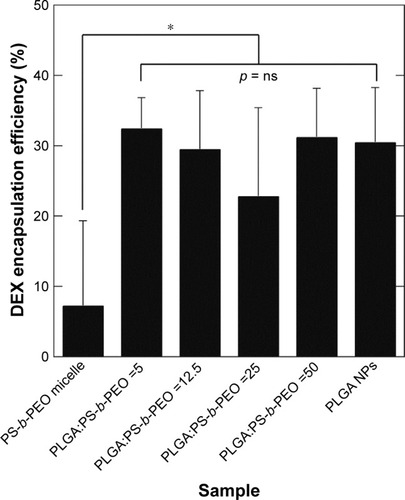
Table 3 Solubility parameters (J1/2/cm3/2) computed using the group contribution method
Figure 7 (A) Cumulative drug release and (B) fractional drug release from PS-b-PEO micelles (□), PolyDots (PLGA:PS-b-PEO =5 (Δ), 12.5 (∇), 25 (◊), 50 (*)), and PLGA NPs (□). Inset: Mt/M∞ for days 0–7.
Abbreviations: DEX, dexamethasone; PS-b-PEO, poly(styrene-b-ethylene oxide); PLGA, poly(lactic-co-glycolic acid); NPs, nanoparticles.
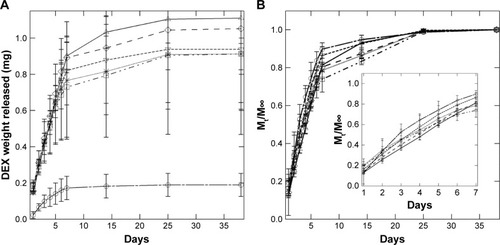
Table 4 Diffusional exponents and rate constants from the Peppas equation
Figure 8 PolyDots maintain morphology and encapsulant properties following lyophilization. (A) Freshly synthesized and (B) lyophilized PolyDots demonstrate similar, spherical morphology as observed in TEM. (C) Fluorescence spectra: gray markers represent lyophilized sample and white markers represent freshly prepared sample. (D) Maximum fluorescence intensity of freshly synthesized and lyophilized PolyDots. Scale bars =500 nm.
Abbreviation: TEM, transmission electron microscopy.
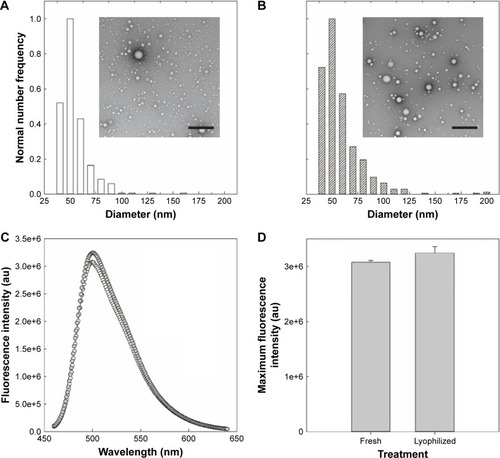
Figure 9 PolyDot uptake by LN229 and U87 glioma cells. Cultured (A–D) LN229 and (E–H) U87 cells exposed to PolyDot-containing medium and fixed after (A and E) 30 minutes, (B and F) 3 hours, (C and G) 90 minutes, and (D and H) 24 hours. At 30 minutes posttreatment, LN229 cells show internalization of PolyDots (arrow, A) as well as non-internalized particles (arrowheads, A). Similarly, at 3 hours posttreatment, LN229 cells show internalized (arrow, B) and non-internalized (B, arrowhead) PolyDots. At 90 minutes, most of the PolyDots have been internalized by the cells (arrow, C) and become less numerous with time (arrow, D). U87 cells treated with PolyDot-containing medium display mostly non-internalized PolyDots at 30 minutes (arrowheads, E). At 3 hours posttreatment, there is an increase in internalized PolyDots (arrow, F). Internalized PolyDots can still be detected in U87 cells at 90 minutes (arrow, G) and at 24 hours (arrow, H) posttreatment. Scale bars =20 µm.
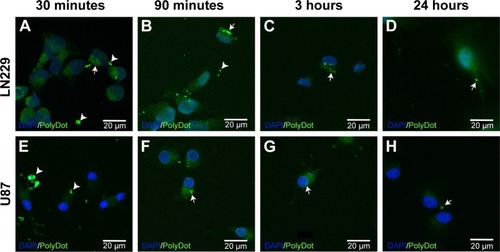
Figure 10 PolyDot 12.5 samples (PLGA:PS-b-PEO =12.5) synthesized via electrospray: (A) representative TEM images and (B) size histogram of TEM data.
Abbreviations: PLGA, poly(lactic-co-glycolic acid); PS-b-PEO, poly(styrene-b-ethylene oxide); TEM, transmission electron microscopy.