Figures & data
Figure 1 Physiochemical properties and release of nanodrug.
Notes: (A) Schematic illustration of non-covalent PEG-coated DEX-CNT. (B) Cryo-TEM images show cylindrical morphologies of DEX-PEG-coated CNT. Note that PEG-coated drugs (ie, DEX) are embedded into the PEG coating. Scale bar: 100 nm. (C) Particle sizes of conventional DEX, PEG-coated CNT, and DEX-PEG-coated CNT in PBS (pH 7.0). There was a similar size distribution between DEX-PEG-coated CNT and DEX. (D) Electric potential showed that DEX-PEG-coated CNT exhibited an average charge compared to conventional DEX and PEG-coated CNT. (E) FTIR spectra of DEX-PEG-coated CNT confirmed major molecular vibration peaks from DEX and PEG-coated CNT. FTIR spectra confirm a coincidence of several IR peaks (*) between the free DEX and conjugated drugs. (F) In vitro DEX release from PEG-coated CNT was analyzed in neutral conditions (pH 7.0), acidic conditions (pH 5.0), and lysozyme-added acidic conditions (pH 5.0) for up to 288 h (both pH 7.0 and 5.0). All data represent mean ± SEM (n=3).
Abbreviations: ABS, acetate-buffered saline; CNT, carbon nanotube; Cryo-TEM, Cryo-transmission electron microscopy; DEX, dexamethasone; FTIR, Fourier transform infrared; PBS, phosphate-buffered saline; PEG, polyethylene-glycol; SEM, standard error of the mean.
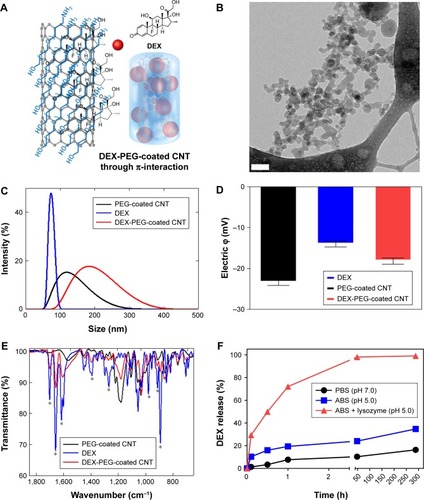
Figure 2 Uptake of nanodrug in TNF-α-stimulated FLS.
Notes: (A, B) FLS and TNF-α-stimulated FLS (2×10⁴ cells/well in 24-well plates) were treated with 0.5 μg/mL Alexa 488-labeled DEX-PEG-coated CNT for 24 h. The fluorescence was visualized using (A) confocal microscopy (×400) and (B) densitometric analysis. Scale bar: 20 μm. The results are presented as mean ± SEM (n=10). ***P<0.001, as compared with control. (C) Enhanced caveolin-mediated endocytosis (33%) of DEX-PEG-coated CNT in TNF-α-stimulated FLS was identified compared to normal FLS.
Abbreviations: CNT, carbon nanotube; DEX, dexamethasone; FLS, fibroblast-like synoviocytes; PBS, phosphate-buffered saline; PEG, polyethylene-glycol; SEM, standard error of the mean; TNF-α, tumor necrosis factor-α.
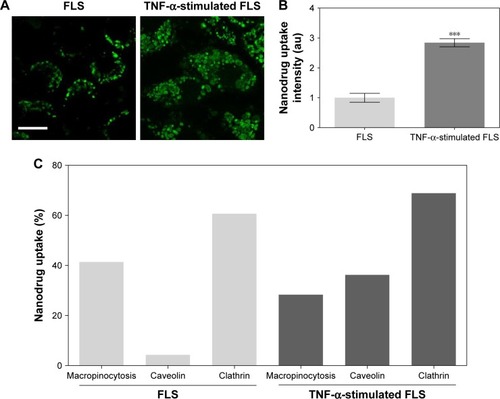
Figure 3 Caveolin-mediated endocytosis affects uptake of DEX-PEG-coated CNT in TNF-α-stimulated FLS.
Notes: (A, B) FLS and TNF-α-stimulated FLS were pretreated with 200 μM caveolin-mediated endocytosis inhibitor (GEN) for 30 min and then treated with 0.5 μg/mL DEX-Alexa 488-labeled PEG-coated CNT for 2 h. The fluorescence was visualized by confocal microscopy (×400) and densitometric analysis. Scale bar: 20 μm. The results are presented as mean ± SEM (n=10). ***P<0.001, as compared with GEN non-treated group in TNF-α-stimulated FLS.
Abbreviations: CNT, carbon nanotube; DEX, dexamethasone; FLS, fibroblast-like synoviocytes; GEN, genistein; PEG, polyethylene-glycol; SEM, standard error of the mean; TNF-α, tumor necrosis factor-α.
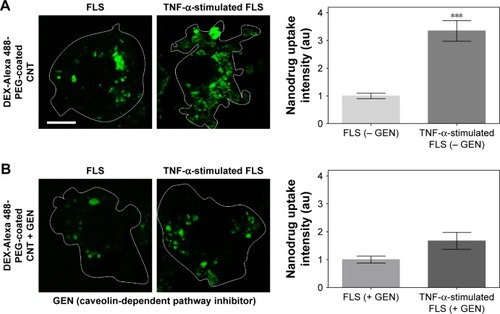
Figure 4 Intracellular nanodrug delivery in TNF-α-stimulated FLS.
Notes: (A) Time-dependent co-localization of Alexa 488-labeled DEX-PEG-coated CNT (green) and EE (red, anti-EEA1) in FLS and TNF-α-stimulated FLS were visualized by fluorescence microscopy. Scale bar: 20 μm. (B) Magnified image shows co-localization regions of Alexa 488-labeled DEX-PEG-coated CNT with EE in FLS (5 h) and TNF-α-stimulated FLS (2 h). Scale bar: 20 μm. (C) Time-dependent co-localization of Alexa 488-labeled DEX-PEG-coated CNT with EE (red, EEA1) and LE for FLS and TNF-α-stimulated FLS were counted. The high formation rate and number of EE vesicles were shown in TNF-α-stimulated FLS at 2 h and in normal FLS at 5 h. No notable co-localization of Alexa 488-labeled DEX-PEG-coated CNT with LE was detected. All data represent mean ± SEM (n=10).
Abbreviations: CNT, carbon nanotube; DEX, dexamethasone; EE, early endosome; EEA1, early endosome antigen-1; FLS, fibroblast-like synoviocytes; LE, late endosome; PBS, phosphate-buffered saline; PEG, polyethylene-glycol; SEM, standard error of the mean; TNF-α, tumor necrosis factor-α.
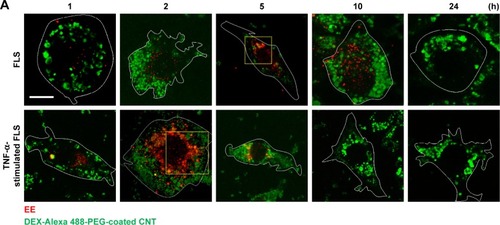
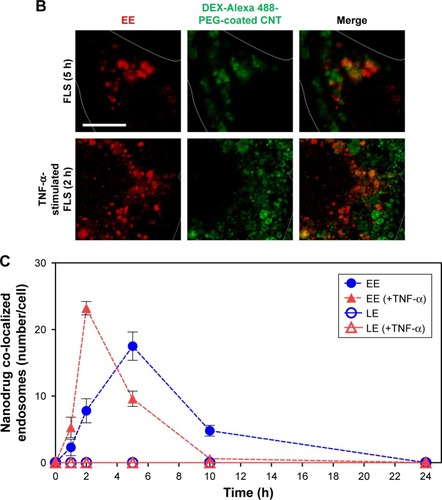
Figure 5 Effect of DEX-PEG-coated CNT on mitochondrial membrane disruption in TNF-α-stimulated FLS.
Notes: (A, B) JC-1 staining showed depolarized mitochondria (green, J-monomer) and polarized mitochondria (red, J-aggregate) membrane potentials after 24 h. H2O2 (50 μM) was used as a positive control. Scale bar: 20 μm. PEG-coated CNT (1 μg/mL) showed no significant changes in the greater level of mitochondrial membrane disruption (green). DEX-PEG-coated CNT inhibited mitochondrial membrane disruption at low doses (0.25 μg/mL) compared to DEX (1 μg/mL) in TNF-α-stimulated FLS. All data represent mean ± SEM (n=6). ***P<0.001 compared to the DEX group.
Abbreviations: CNT, carbon nanotube; DEX, dexamethasone; FLS, fibroblast-like synoviocytes; H2O2, hydrogen peroxide; PEG, polyethylene-glycol; SEM, standard error of the mean; TNF-α, tumor necrosis factor-α.

Figure 6 Effects of nanodrug on oxidative stress in TNF-α-stimulated FLS.
Notes: (A) FLS (2×10⁴ cells/well in 96-well plates) were treated with various concentrations of DEX, PEG-coated CNT, and DEX-PEG-coated CNT for 24 h. After treatment, the cells were stained with 10 μM DCF-DA for 30 min. The fluorescent intensity of DCF-DA was recorded using a fluorescent plate reader. All data represent mean ± SEM (n=5). ##P<0.01; and ***P< ###P<0.001, compared to the TNF-α-stimulated positive control. (B) Cells (4×10⁵ cells/well in 6-well plates) were treated with DEX-PEG-coated CNT (0.25 μg/mL), DEX, and PEG-coated CNT (1 μg/mL) for 24 h. SOD activity was determined using a tetrazolium-based SOD assay kit. H2O2 (100 μM) was used as a positive control. The results are presented as mean ± SEM (n=3). ***P<0.01 significantly different from DEX-treated group.
Abbreviations: CNT, carbon nanotube; DCF-DA, 2′,7′-dichlorodihydrofluorescein diacetate; DEX, dexamethasone; FLS, fibroblast-like synoviocytes; H2O2, hydrogen peroxide; PEG, polyethylene-glycol; ROS, reactive oxygen species; SEM, standard error of the mean; SOD, superoxide dismutase; TNF-α, tumor necrosis factor-α.
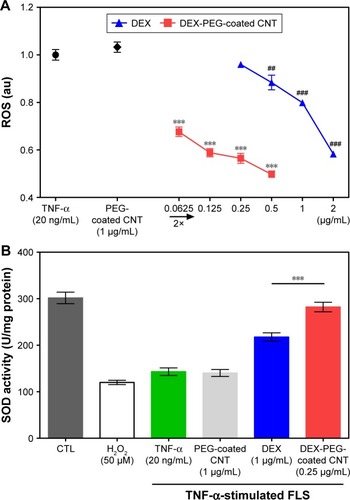
Figure 7 Low-dose efficacy of nanodrug on mRNA expression of cytokines and MMPs in TNF-α-stimulated FLS.
Notes: (A–C) Suppressed inflammation, such as (A) TNF-α, (B) IL-β, and (C) IL-6, by the treatment of drug (concentration ranges were 0.25–2 μg/mL for DEX and 0.0625–0.5 μg/mL for DEX-PEG-coated CNT). FLS were pretreated with PEG-coated CNT, DEX, or DEX-PEG-coated CNT 2 h before stimulation with TNF-α (20 ng/mL) for 12 h. DEX-PEG-coated CNT inhibited TNF-α, IL-β, and IL-6 mRNA expression at the concentration of 0.0625 μg/mL. (D, E) Suppressive inflammatory drug concentration ranges were 1–2 μg/mL for DEX and 0.0625–0.5 μg/mL for DEX-PEG-coated CNT. Treatment with DEX and DEX-PEG-coated CNT was carried out 2 h before stimulation with TNF-α (20 ng/mL) for 12 h. Note that DEX-PEG-coated CNT significantly suppressed MMP-1 and MMP-3 at the concentration of 0.0625 μg/mL. The expression levels of cytokines and MMPs were determined by real-time PCR. All data represent mean ± SEM (n=3). #P<0.05; **P< ##P<0.01; and ***P< ###P<0.001, compared to the TNF-α-stimulated positive control.
Abbreviations: CNT, carbon nanotube; DEX, dexamethasone; FLS, fibroblast-like synoviocytes; IL-β, interleukin-β; IL-6, interleukin-6; MMP, matrix metalloproteinase; mRNA, messenger RNA; PCR, polymerase chain reaction; PEG, polyethylene-glycol; SEM, standard error of the mean; TNF-α, tumor necrosis factor-α.
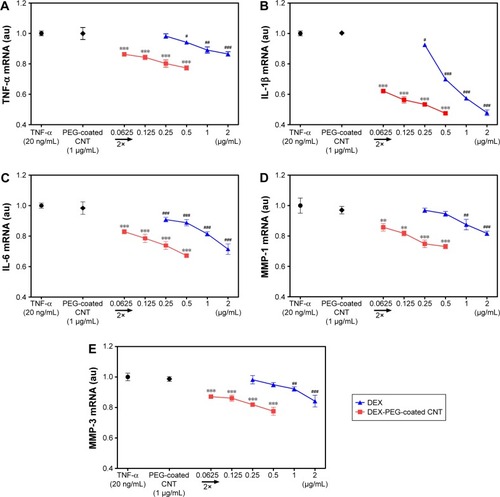
Figure 8 Low-dose efficacy of nanodrug on protein expression of cytokines and MMPs in TNF-α-stimulated FLS.
Notes: (A–C) FLS cells were pretreated with 0.25 μg/mL DEX-PEG-coated CNT (PEG-coated CNT: 1 μg/mL, DEX: 1 μg/mL) for 2 h, and then stimulated with TNF-α (20 ng/mL) for 24 h. The levels of TNF-α, IL-1β, and IL-6 were measured in the culture medium by ELISA. All data represent mean ± SEM. *P<0.05, **P<0.05, and ***P<0.01 compared to the TNF-α-stimulated positive control. The data are presented as mean ± SEM (n=3). (D) Changes in protein levels of MMP-1 and MMP-3 were analyzed by Western blot analysis. Cells were pretreated with DEX (1 μg/mL), PEG-coated CNT (0.04 μg/mL), and DEX-PEG-coated CNT (0.25 μg/mL) 20 min before stimulation with TNF-α (20 ng/mL) for 24 min. β-actin was used as a loading control.
Abbreviations: CNT, carbon nanotube; DEX, dexamethasone; ELISA, enzyme-linked immunosorbent assay; FLS, fibroblast-like synoviocytes; IL-β, interleukin-β; IL-6, interleukin-6; MMP, matrix metalloproteinase; PEG, polyethylene-glycol; SEM, standard error of the mean; TNF-α, tumor necrosis factor-α.
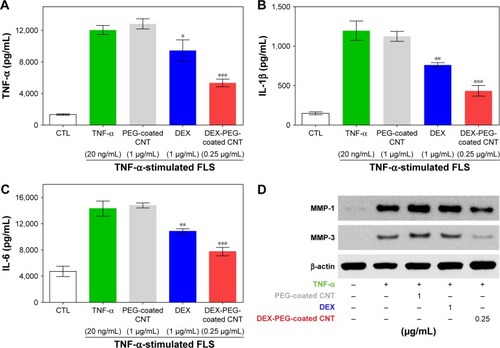
Figure S1 A reaction schematic of DEX-PEG-coated CNT functionalization.
Abbreviations: CNT, carbon nanotube; DEX, dexamethasone; PEG, polyethylene-glycol.
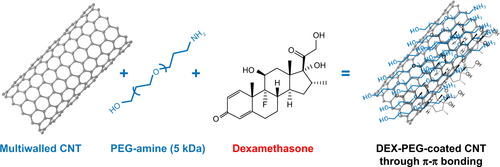
Figure S2 PDI values of PEG-coated CNT, DEX, and DEX-PEG-coated CNT.
Note: PDI values were less than 0.5 for all tested samples.
Abbreviations: CNT, carbon nanotube; DEX, dexamethasone; PDI, polydispersity index; PEG, polyethylene-glycol.
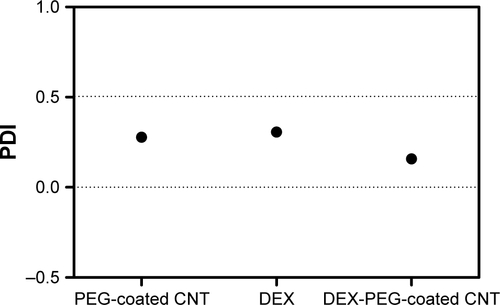
Figure S3 UV-vis spectra confirmed the attached Alexa 488 on DEX-PEG-coated CNT.
Abbreviations: CNT, carbon nanotube; DEX, dexamethasone; PEG, polyethylene-glycol; UV-vis, ultraviolet-visible.
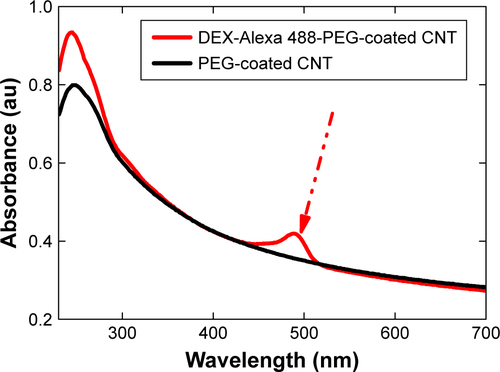
Figure S4 Cytotoxicity of endocytosis inhibitors by FLS was determined by MTT analysis.
Notes: Cells were treated with EIPA (50 μM), CPZ (20 μM), and GEN (200 μM) for 3 h. All data represent mean ± SEM (n=3).
Abbreviations: CTL, not treated control; CPZ, chlorpromazine; EIPA, 5-(N-ethyl-N-isopropyl)amiloride; FLS, fibroblast-like synoviocytes; GEN, genistein; MTT, 3-(4, 5-dimethylthiazol-2-yl)-2, 5 diphenyltetrazolium bromide; SEM, standard error of the mean; TNF-α, tumor necrosis factor-α.
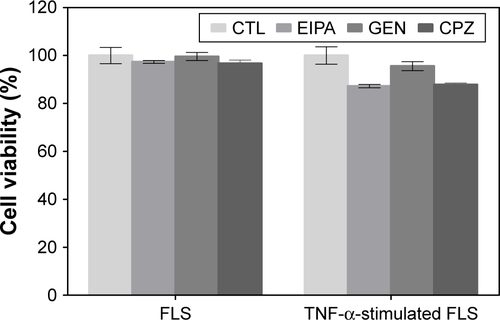
Figure S5 Time-dependent co-localization of dextran-GFP and LE.
Notes: Dextran-GFP was used to develop LE as a positive control. (A) Time-dependent co-localization of dextran-GFP (green) and LE (red, anti-M6PR) in FLS was visualized by fluorescence microscopy. Bar indicates 20 μm. (B) Time-dependent co-localization of dextran-GFP (green) and LE (red, anti-M6PR) for FLS was counted. All data represent the mean ± SEM (n=10).
Abbreviations: FLS, fibroblast-like synoviocytes; GFP, green fluorescent protein; LE, late endosome; M6PR, mannose 6-phosphate receptor; SEM, standard error of the mean.
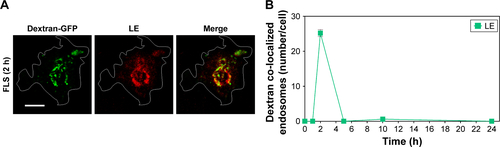
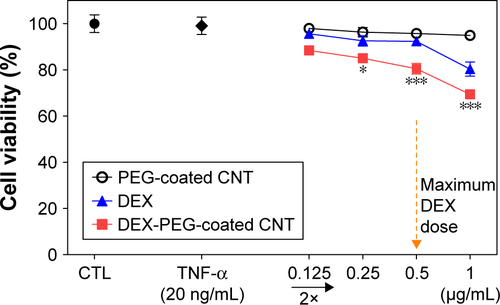
Figure S6 Cytotoxicity of DEX-PEG-coated CNT treated with various concentrations of DEX, PEG-coated CNT, and DEX-PEG-coated CNT, and viability was determined by the MTT assay.
Notes: All data represent mean ± SEM (n=5). *P<0.05 and ***P<0.01 compared to the control.
Abbreviations: CNT, carbon nanotube; DEX, dexamethasone; MTT, 3-(4, 5-dimethylthiazol-2-yl)-2, 5 diphenyltetrazolium bromide; PEG, polyethylene-glycol; SEM, standard error of the mean; TNF-α, tumor necrosis factor-α.