
Figures & data
Figure 1 Structure of all-trans retinoic acid.
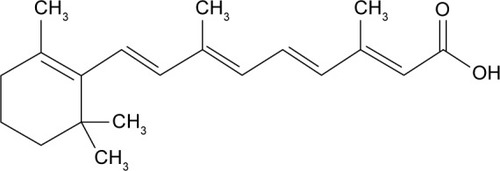
Table 1 Solubility of ATRA in various surfactants/co-surfactants
Figure 2 Pseudo-ternary phase diagram composed of fish oil as the oil phase with various surfactant mixtures (A) oleth-5 and Transcutol P (1:1), (B) oleth-5 and Cetiol HE (1:1), (C) oleth-5 and Tween 20 (1:1) and (D) oleth-5 and Tween 80 (1:1) as surfactant and co-surfactant, respectively. The gray area represents the microemulsion region.
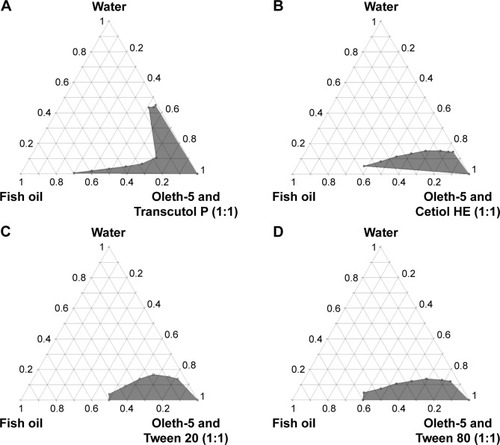
Table 2 Formulations, component ratio, ATRA solubility and ATRA loaded in microemulsions
Figure 3 Pseudo-ternary phase diagram composed of fish oil as the oil phase with various surfactant and co-surfactant mixture (oleth-5 and Transcutol P) ratios (A) 1:1, (B) 2:1, (C) 3:1 and (D) 4:1. The gray area represents the microemulsion region.
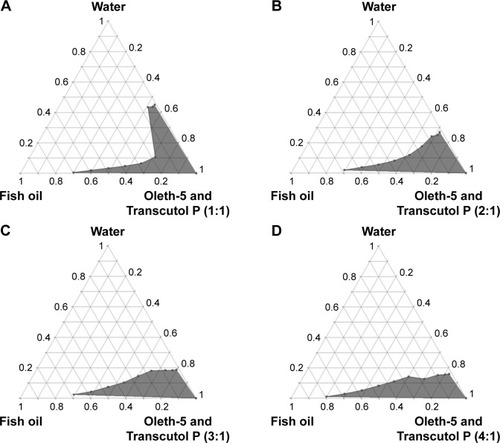
Table 3 Particle size, zeta potential, PDI and electrical conductivity of MEs without ATRA (blank ME) and ATRA-loaded ME
Figure 4 Transmission electron microscopy images of (A) ATRA-loaded ME 1, (B) ATRA-loaded ME 2, (C) ATRA-loaded ME 3 and (D) ATRA-loaded ME 4. Magnification ×200.
Abbreviations: ATRA, all-trans retinoic acid; ME, microemulsion.
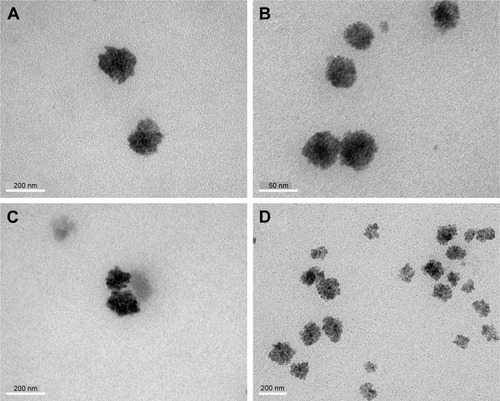
Figure 5 The rheological behaviors of ATRA-loaded ME 1 (Img), ATRA-loaded ME 2 (Img), ATRA-loaded ME 3 (Img) and ATRA-loaded ME 4 (Img). All data represent the (mean ± standard deviation (n=3).
Abbreviations: ATRA, all-trans retinoic acid; ME, microemulsion.
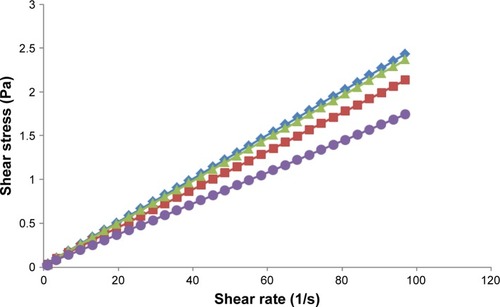
Table 4 In vitro release characteristics of ATRA-loaded MEs
Figure 6 The in vitro percent cumulative release profiles of all-trans retinoic acid from the microemulsion formulations ME 1 (Img), ME 2 (Img), ME 3 (Img) and ME 4 (Img). All data represent the mean ± standard deviation (n=3).
Abbreviation: ME, microemulsion.
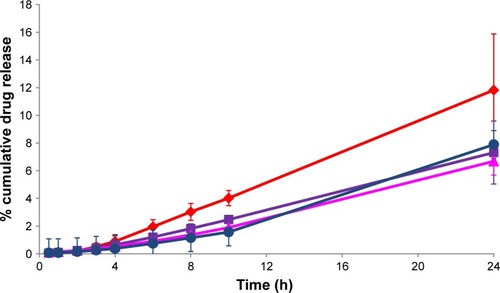
Table 5 The apparent permeability (Papp) of ATRA from each formulation
Figure 7 Confocal laser scanning microscopy images show x–z plane serial penetration of a porcine intestine treated with (A1) nile red in fish oil and (B1) nile red-loaded ME 4 at a time of 3 h, scale bar represents 100 µm. The (A2) and (B2) images are the intensity projections through the z-axis of (A1) and (B1), respectively. The scale bar represents 100 µm.
Abbreviation: ME, microemulsion.
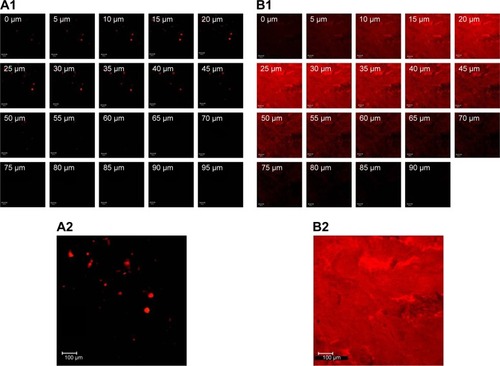
Figure 8 Comparison of fluorescence intensity profiles of nile red at various depths into the intestine shown in . All data represent the mean ± standard deviation.
Abbreviation: AU, arbitrary unit.
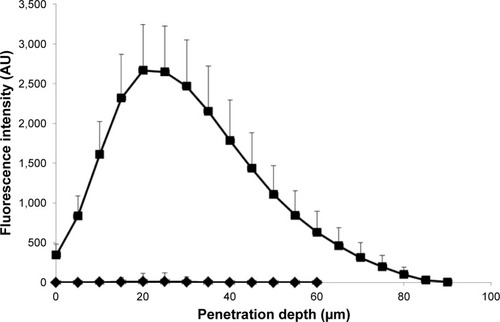
Table 6 The percent cytotoxicity of blank fish oil, blank ME 4 ATRA in fish oil and ATRA-loaded ME 4
Figure 9 H&E-stained porcine intestine treated with (A) phosphate-buffered saline, (B) 3% w/w Triton X-100, (C) ATRA in fish oil and (D) ATRA-loaded ME 4.
Abbreviations: ATRA, all-trans retinoic acid; ME, microemulsion.
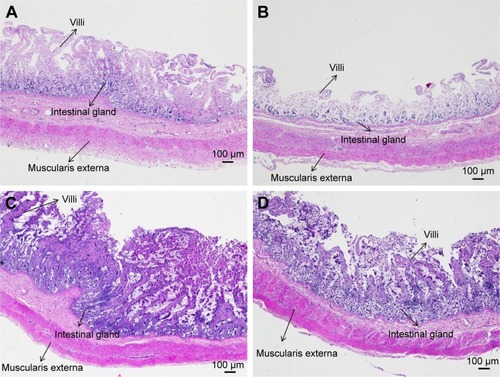
Figure 10 The percentage of ATRA remaining in ME 4 after storage for 0, 1, 2, 3, 4, 5 and 6 months after preparation at 25°C (■) and 40°C (□). Each value represents the mean ± standard deviation (n=3).
Abbreviations: ATRA, all-trans retinoic acid; ME, microemulsion.
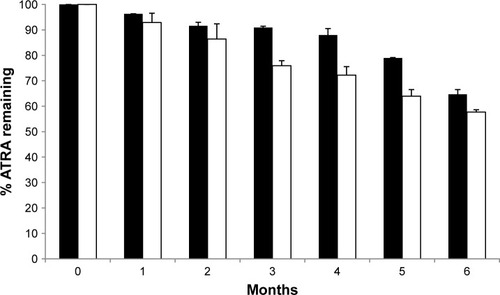
Table 7 The mean particle size of ATRA-loaded ME 4 at baseline, 1, 2, 3, 4, 5 and 6 months after preparation stored at 25°C and 40°C
Table 8 Zeta potential of ATRA-loaded ME 4 at baseline, 1, 2, 3, 4, 5 and 6 months after preparation stored at 25°C and 40°C