Figures & data
Figure 1 LNPs characterization.
Notes: LNPs were produced by mixing lipids’ solution and siRNA solution drop by drop under strong vortex, and ethanol was removed by ultracentrifugation (A). The encapsulation efficiencies of LNPs were above 95% (B). The diameter of LNPs was 67±4.3 nm (C).
Abbreviations: LNP, lipid nanoparticle; siRNA, small interference RNA.
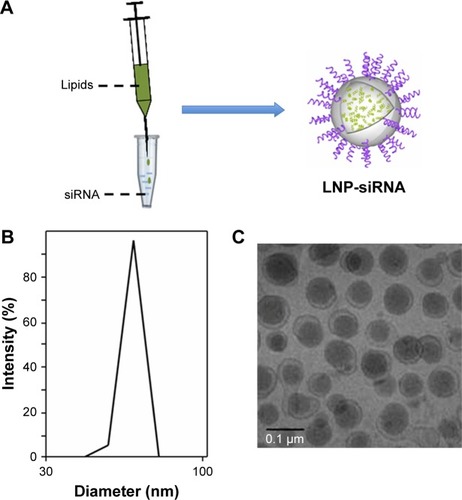
Figure 2 LNPs transfection efficiency.
Notes: There was no fluorescent signal in the free siRNA-treated chondrocytes, while almost every LNP-siRNA chondrocyte fluoresced green (A); magnification ×10. Three-dimensional images showed that all the fluorescent signals were actually located in the cytoplasm (B), indicating that LNPs can effectively deliver siRNA into the chondrocytes. Flow cytometry analysis further showed that transfection rate was close to 0% in free siRNA-treated group, and almost 100% in the LNP-siRNA-treated group (C). Cartilage tissue cultures showed that fluorescent signal was not only present in the superficial zone but also in the deep layer of the LNP-beacon-treated pig cartilage, whereas no signal was detected in control samples (D); magnification ×4.
Abbreviations: GFP, green fluorescent protein; LNP, lipid nanoparticle; siRNA, small interference RNA.
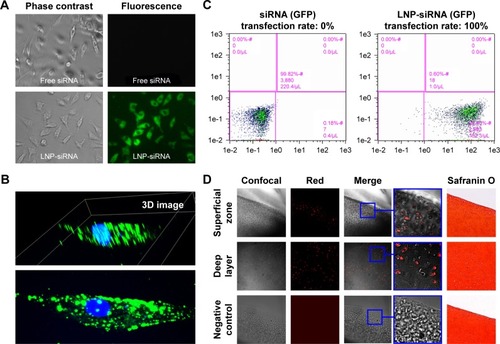
Figure 3 Effect of LNPs on cell toxicity and proliferation.
Notes: Green fluorescence indicates live cells and red fluorescence indicates dead cells. We did not detect dead cells in the blank or LNPs-treated groups. All cells in the freeze-thawed group were dead (A); magnification ×10. Fluorescence-activated cell sorting data showed that 1% (v/v) and 2% (v/v) LNP groups increased cell viability (B and C). LNPs were even able to promote cell proliferation after 24 hours of treatment, but there was no statistically significant difference among the blank and LNPs-treated groups after 48 hours of treatment (D). Compared with blank, *P<0.01.
Abbreviations: FDA, Fluorescein diacetate; LNP, lipid nanoparticle; PI, propidium iodide; siRNA, small interference RNA.
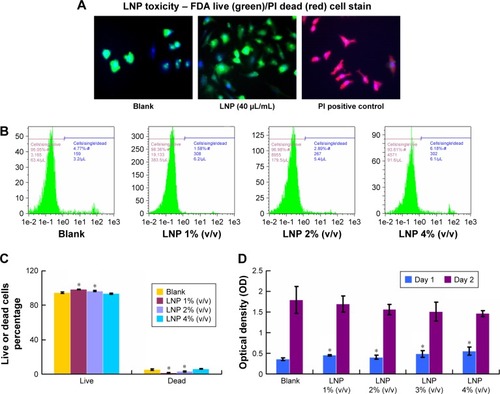
Figure 4 siRNA could be delivered into cartilage cells by LNPs and functioned in vivo.
Notes: Fluorescent signals could be detected by fluorescence molecular tomography in the LNP-beacon-treated mouse knee joint (red rectangles). In contrast, no fluorescent signal could be detected in the free-beacon-treated mouse knee joint (yellow rectangles) (A). The LNP-beacon-treated cartilage was further observed by confocal microscopy, and red signals were located in all of the cartilage tissue layers. In contrast, no signal was detected in the free-beacon-treated cartilage; magnification ×10 (B). Similar to mice cartilage data, red signals were present in the LNP-beacon-treated rat knee joint cartilage, whereas no signal was found in the free-beacon-treated rat knee joint cartilage; magnification ×10 for panels on the left and magnification ×20 for the insets (C). No positive signal could be detected by confocal microscope from either LNP-beacon-treated or free-beacon-treated rat knee joint synovial membrane; magnification ×10 (D). Fluorescent signals could be detected by fluorescence microscopy in the LNP-Cy3-labeled siRNA-treated rat knee cartilage. In contrast, no fluorescent signal was detected in the free Cy3-labeled siRNA-treated rat knee cartilage; magnification ×10 (E). After 24 hours of in vivo treatment with LNP-GAPDH siRNA or LNP-Ihh siRNA, cartilage GAPDH mRNA decreased by 51.8% and Ihh mRNA decreased by 79.7% (F).
Abbreviations: GAPDH, glyceraldehyde-3-phosphate dehydrogenase; Ihh, Indian Hedgehog; LNP, lipid nanoparticle; siRNA, small interference RNA.
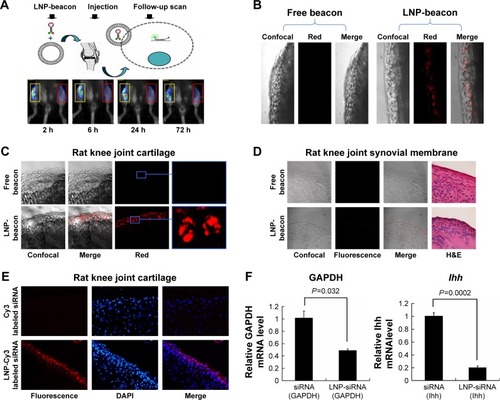
Figure 5 LNP-siRNA lasts for 7 days at least in the rat knee joint.
Notes: Fluorescent signals were monitored dynamically by FMT. There was no signal in the left knee (red ovals). In contrast, fluorescent signals lasted for 7 days and reached climax at day 2 in the right knee (yellow ovals) (A). Quantitative data indicated that fluorescence signals could be detected after 4 hours and reached climax on day 2, then decreased gradually (B). Seven days after LNP-Ihh siRNA in vivo treatment, cartilage Ihh mRNA decreased by 44.1% and type II collagen mRNA level significantly increased, while type X collagen mRNA level decreased. Values are mean ± standard error of the mean. *P<0.01 versus siRNA (Ihh) treatment group (C).
Abbreviations: FMT, fluorescence molecular tomography; Ihh, Indian Hedgehog; LNP, lipid nanoparticle; siRNA, small interference RNA.
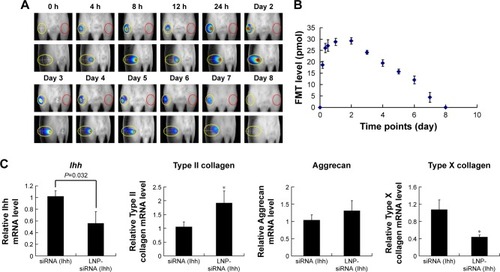
Figure 6 Intra-articular LNP-Ihh siRNA can attenuate the pathogenesis of surgery-induced OA.
Notes: There was less surface damage with stronger Safranin O staining in articular cartilage specimens from LNP-Ihh siRNA-treated animals as compared with those from untreated controls (A). Quantitative data indicated that cartilage damage was reduced in rats that received LNP-Ihh siRNA as compared to ACLT rats with free Ihh siRNA treatment (B). Type II collagen expression in articular cartilage was higher in the LNP-Ihh siRNA-treated and the sham-operated rats, than in rats that underwent ACLT and free Ihh siRNA treatment. In contrast, degraded collagen II, MMP-13, and type X collagen staining were elevated in rats that underwent ACLT and Ihh-siRNA treatment with respect to the LNP-Ihh siRNA-treated and sham-operated rats, which is consistent with reduced OA damage. The bigger inset boxes are original picture (magnification ×10). The smaller inset boxes are the parts shown in the panels (magnification ×20). (C). Real-time polymerase chain reaction indicates that intra-articular LNP-Ihh siRNA inhibits catabolism and enhances anabolic metabolism. Values are the mean ± standard error of the mean. *P<0.01 versus the ACLT and Ihh siRNA treatment group (D).
Abbreviations: ACLT, anterior cruciate ligament transection; Ihh, Indian Hedgehog; LNP, lipid nanoparticle; MMP-13, matrix metalloproteinase 13; OA, osteoarthritis; siRNA, small interference RNA.
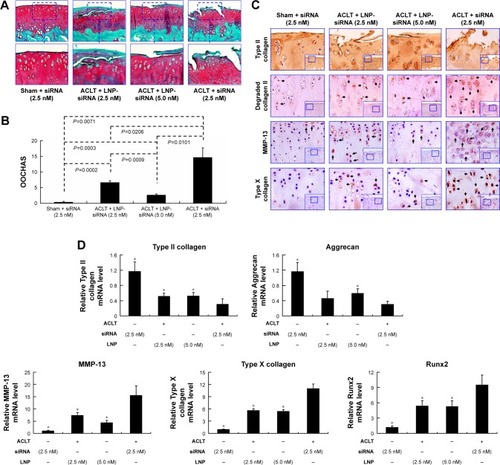
Figure S1 LNPs transfection efficiency.
Notes: Fluorescence signals were obvious in the LNP-control siRNA-treated cells including astrocytes, chondrocytes cell line C28/I2, chondrogenic cell line ATDC5, and breast cancer cell line MCF-7. In contrast, there were no fluorescent signals when these cells were treated with free control siRNA.
Abbreviations: DAPI, 4′,6-diamidino-2-phenylindole; LNP, lipid nanoparticle; siRNA, small interference RNA.
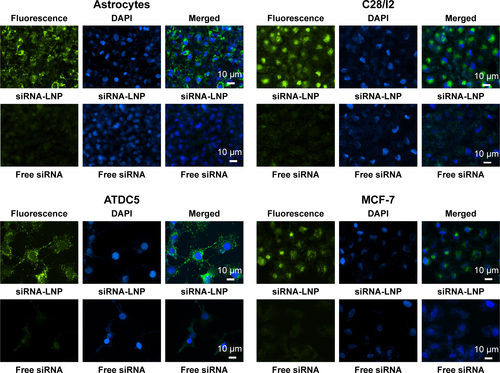
Figure S2 Validated mouse intra-articular injection.
Notes: Twenty microliters of alcian blue solution was injected with an insulin syringe into the mouse knee joint cavity (A). The mouse was sacrificed after 24 hours and the knee joint cavity was opened by a scalpel. Gross observation showed that alcian blue adhered to the cartilage and synovial membrane in the joint cavity, indicating that intra-articular injection was feasible for the study (B).
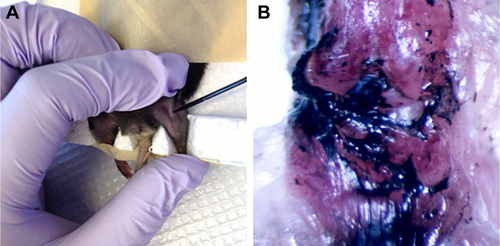
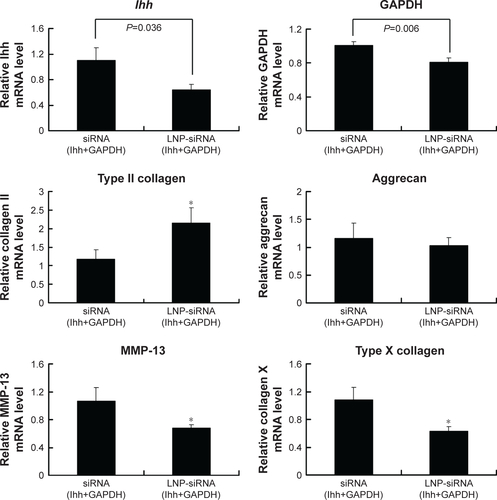
Figure S3 Targeted multiple genes in vivo.
Notes: Cartilage Ihh and GAPDH genes were knocked down together by LNP-siRNA (Ihh+GAPDH) in vivo. Ihh mRNA level decreased by 41.6% and GAPDH mRNA level decreased by 19.5%. Type II collagen mRNA level increased significantly, but there was no difference in the aggrecan mRNA levels of LNP-siRNA (Ihh+GAPDH)-treated cartilage and free siRNA (Ihh+GAPDH) cartilage. In contrast, MMP-13 and type X collagen mRNA levels significantly decreased in our treatment groups. Values are the mean ± standard error of the mean. *P<0.01 versus the ACLT and Ihh siRNA treatment group.
Abbreviations: ACLT, anterior cruciate ligament transection; GAPDH, glyceraldehyde-3-phosphate dehydrogenase; Ihh, Indian Hedgehog; LNP, lipid nanoparticle; mRNA, messenger RNA; MMP-13, matrix metalloproteinase 13; siRNA, small interference RNA.