Figures & data
Figure 1 Diffusion cell for in vitro studies.
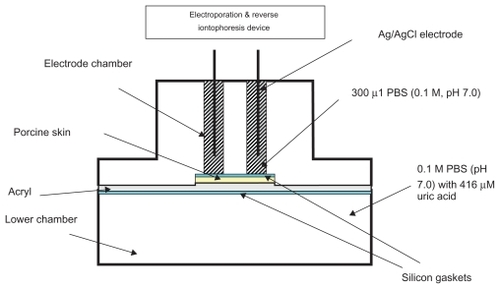
Figure 2 Diffusion cell (diameter = 27 mm) for human studies. Each electrode chamber had a diameter of 5 mm and they were 11 mm apart.
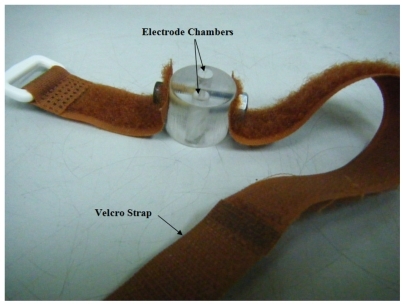
Figure 3 Experimental protocol showing the time sequence for the application of electroporation, reverse iontophoresis, and sample collection.
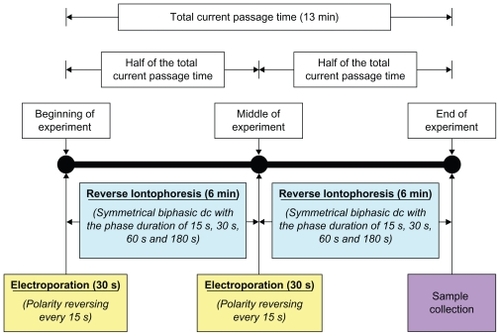
Table 1 Experimental protocol for the in vitro studies
Figure 4 In vitro studies of the transdermal and noninvasive extraction of uric acid by different combinations of reverse iontophoresis (RI) and electroporation (EP). For the RI setting, it was a symmetrical biphasic dc with the current density of 0.3 mA/cm2. The legend shows the electroporation setting where PW and P/s are the pulse width and pulse per second of the electroporation, respectively.
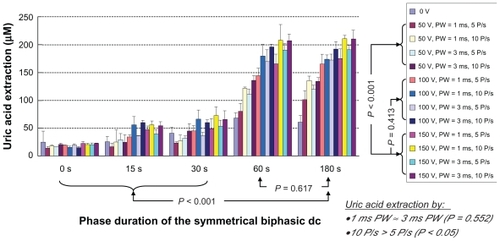
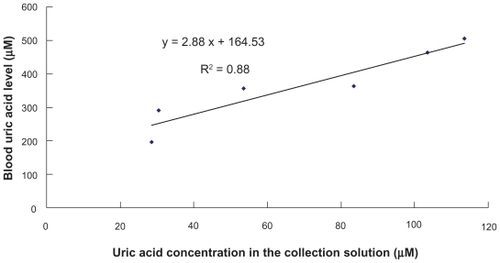
Figure 5 Comparison of real blood uric acid levels of subjects and uric acid concentrations in the collection solution after the application of the optimum combination of reverse iontophoresis and electroporation.