Figures & data
Table 1 Characteristics of the block copolymers
Figure 1 Overall scheme for the synthesis of PEG-b-PLL(-g-Ce6, DMA)-b-PLA and its validation by 1H NMR.
Notes: The Ce6 conjugation was confirmed by the presence of an 1H NMR (DMSO-d6; Cambridge Isotope Lab. Inc., Tewksbury, MA, USA) peak at δ 6.0–6.5 and the DMA conjugation was confirmed by the presence of an 1H NMR peak at δ 1.8–2.0.
Abbreviations: Ce6, Chlorin e6; DCC, N,N′-dicyclohexylcarbodiimide; DMA, 2,3-dimethyl maleic anhydride; DMSO, dimethyl sulfoxide; NHS, N-hydroxysuccinimide; PEG, poly(ethylene glycol); PLA, poly(lactic acid); PLL, poly(l-lysine); TEA, triethylamine.
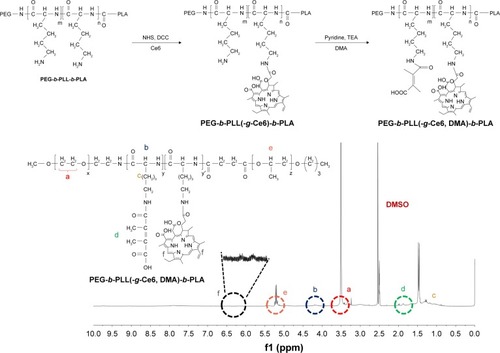
Figure 2 Characterization of CDTM. Change in (A) particle size and (B) zeta potential of CDTM at different pH (n=3).
Notes: The prepared micelles were exposed to a specific pH condition (PBS 1×, pH 5.5–8.5) and the pH of each buffered solution was finally adjusted by a pH meter before use. The average particle size and zeta potential values were calculated from three measurements performed on each sample (n=3).
Abbreviation: CDTM, PEG-PLL(-g-Ce6 and DMA)-PLA micelles.
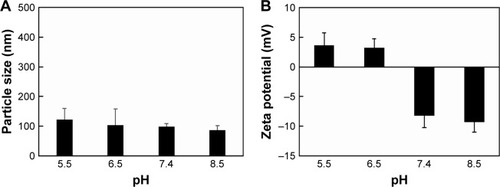
Figure 3 Physicochemical characteristics of free Ce6 and CDTM.
Notes: (A) Fluorescence image of free Ce6 and CDTM in PBS based on an equivalent Ce6 concentration (2 μg/mL). (B) Singlet oxygen generation of free Ce6 and CDTM in PBS (2 μg/mL). (C) Optical image and UV–Vis spectrum scan of CDTM and free Ce6 in distilled water. When the pH decreased from 7.4 to 4.5, the physicochemical characteristics of free Ce6 changed due to aggregation, whereas CDTM showed consistent physicochemical characteristics over the whole pH range, demonstrating the conjugation of Ce6 to the lysine residue.
Abbreviations: Ce6, chlorin e6; CDTM, PEG-PLL(-g-Ce6 and DMA)-PLA micelles; PBS, phosphate buffered saline.
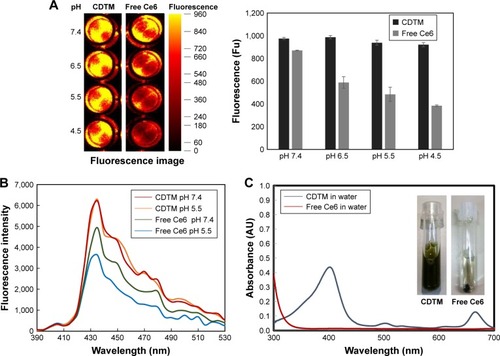
Figure 4 (A) Cellular uptake of Ce6 in KB cells at different pH after a 2 h incubation. (B) ROS generation in KB cells treated with CDTM after irradiation with light dose 5.2 mW/cm2 for 100 s or 200 s. (C) Viability of KB cells treated with samples at different pH. (D) Flow cytometric analysis of time-dependent apoptosis and necrosis in KB cells using annexin V FITC and propidium iodide double staining. The KB cells were incubated with CDTM (equivalent Ce6 1 μg/mL) for 4 h, then irradiated with 5.2 mW/cm2 for 100 s and harvested after 1, 3, 6, and 24 h (E). Wound healing assay to evaluate the migration of KB cells treated with CDTM and PBS (Ce6 =0.25 μg/mL).
Abbreviations: CDTM, PEG-PLL(-g-Ce6 and DMA)-PLA micelles; Ce6, chlorin e6; ROS, reactive oxygen species.
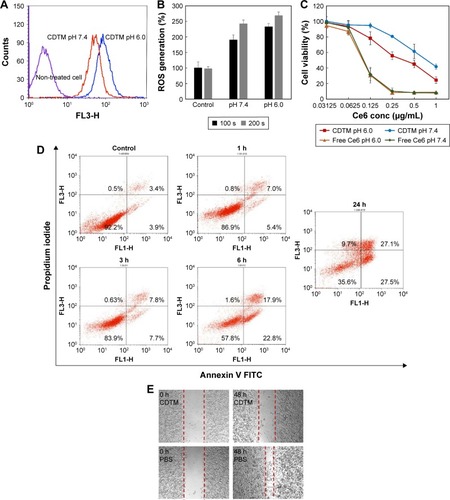
Figure 5 In vivo non-invasive fluorescent imaging of free Ce6, CTM, and CDTM injected intravenously into KB tumor-bearing nude mice.
Notes: The accumulation of CDTM at the tumor site was significantly higher than in the organs, which was comparable to that observed after the administration of CTM and free Ce6. (A) Whole body imaging at given time points after administered via tail vein injection and (B) fluorescence images of isolated liver, spleen, kidney, heart, lung and tumor after 24 h post injection. (C) Quantitative fluorescence intensities of tumors and main organs. The FI ratios of the tumor to liver (FI in tumor/FI in liver) for free Ce6, CTM, and CDTM were 1.10, 1.01, and 3.02, respectively.
Abbreviations: CDTM, PEG-PLL(-g-Ce6 and DMA)-PLA micelles; Ce6, chlorin e6; CTM, PEG-PLL(-g-Ce6)-PLA micelles; FI, fluorescence intensity.
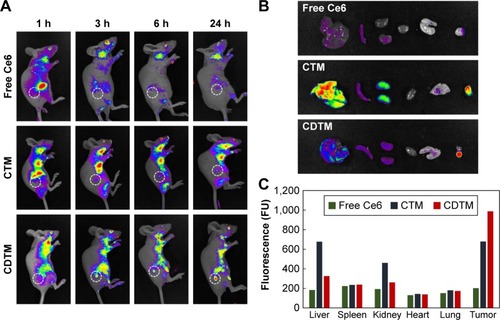
Figure 6 (A) In vivo anticancer efficacy and (B) body weight changes in KB tumor-bearing BALB/c nude mice after intravenous administration of PBS, free Ce6, CTM, and CDTM. (C) The optical images of tumor-bearing mice at day 1 and day 15.
Abbreviations: CDTM, PEG-PLL(-g-Ce6 and DMA)-PLA micelles; Ce6, chlorin e6; CTM, PEG-PLL(-g-Ce6)-PLA micelles.
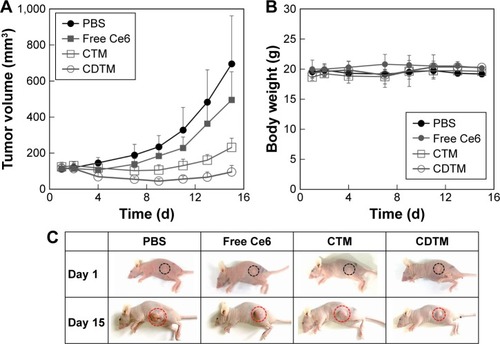
Figure 7 Schematic representation depicting the main concept of charge-reversible PDT.
Abbreviations: Ce6, chlorin e6; DMA, 2,3-dimethyl maleic anhydride; EPR, enhanced permeability and retention; PDT, photodynamic therapy; PEG, poly(ethylene glycol); PLA, poly(lactic acid); PLL, poly(l-lysine).
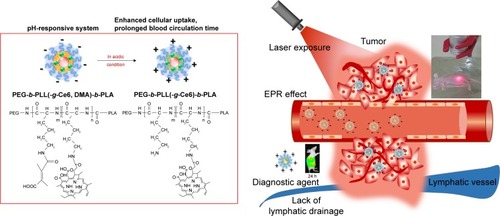
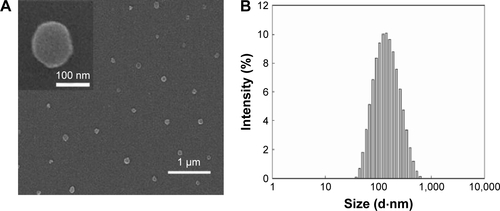
Figure S1 Characterization of CDTM. FE-SEM imaging (A) and particle size distribution (B) of CDTM at pH 7.4.
Notes: The morphology of CDTM at pH 7.4 obtained from FE-SEM revealed regular spherical particles with a narrow size distribution. Magnification ×20,000.
Abbreviations: CDTM, PEG-PLL(-g-Ce6 and DMA)-PLAmicelles; FE-SEM, field emission scanning electron microscope.