Figures & data
Table 1 The recovery, particle size, and polydispersity indices of theophylline nanoparticles and theophylline agglomerates
Figure 1 Nanoparticles (A), close up of theophylline nanoparticles (B), theophylline controlled agglomerates (C), close up of theophylline controlled agglomerates (D), aggregation of theophylline nanoparticles upon using high concentration of NaCl (E), and theophylline powder without processing (F). Note the circles that showing the mechanism of self-assembly of nanorods on a copper grid. The arrows show fluffy spherical nanorods of the controlled agglomerates.
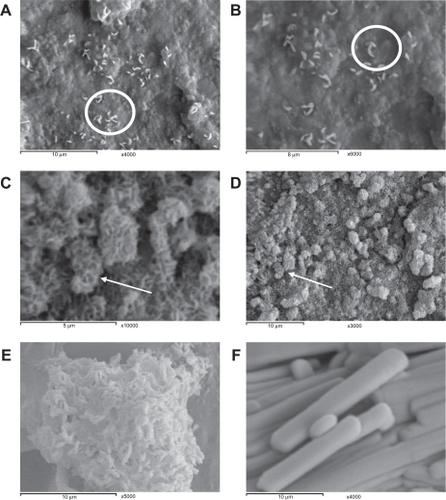
Table 2 The differences in zeta potential between nanoparticles and agglomerates at different pH ranges upon addition of diluted NaCl (0.5 mL, 10−3M) solution (n = 3)
Table 3 Flowability parameters of theophylline powder, theophylline nanoparticles, and nanorose agglomerates
Table 4 Differential scanning calorimetry peak integrations for theophylline powder, stearic acid powder, theophylline nanoparticles, and theophylline agglomerates in the lyophilized form
Figure 2 Differential scanning calorimetry thermograms for stearic acid, theophylline, theophylline nanoparticles, and theophylline agglomerates.
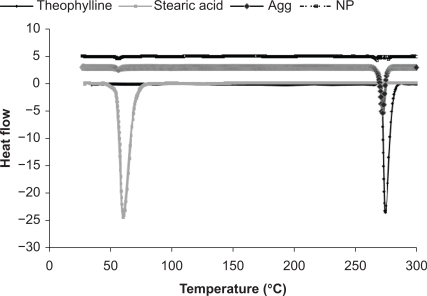
Figure 3 Cumulative drug released against time for the theophylline powder, theophylline nanoparticles, and theophylline agglomerates (n = 3 ± standard deviation).
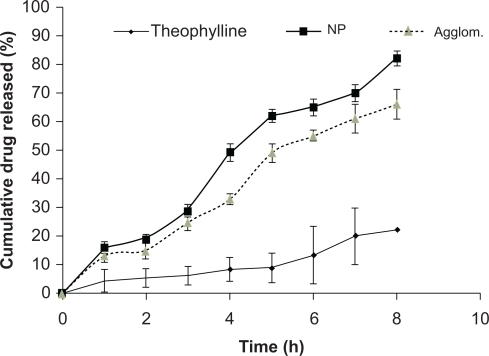
Table 5 The aerodynamic characteristics of theophylline, theophylline nanoparticles, and theophylline agglomerates