Figures & data
Figure 1 Analysis of QD size measured using AFM and DLS, and representative AFM micrograph of QDs dispersed on freshly cleaved mica surface.
Notes: The hydrodynamic diameter was measured using a DLS device Zeta Plus PALS (Brookhaven Inc., Holtsville, NY, USA). AFM Innova (Veeco Inc., Plainview, NY, USA) was used for QD imaging in the tapping mode using silicon nitride probes.
Abbreviations: AFM, atomic force microscopy; DLS, dynamic light scattering; QDs, quantum dots.
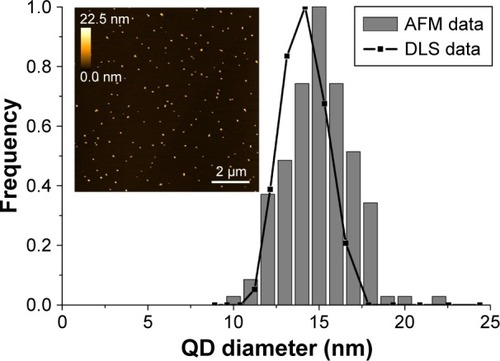
Figure 2 (A) Morphology of isolated dermal MSCs. Magnification 10×, scale bar 400 µm. (B) Immunophenotype of MSCs.
Notes: Black curve, control; green, mesenchymal markers; red, hematopoiesis markers. Percentage shows positive events.
Abbreviation: MSCs, mesenchymal stem cells.
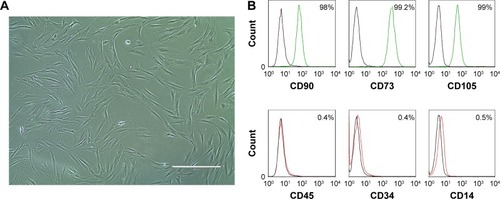
Figure 3 (A) QD cytotoxicity to MSCs. (B) Dynamics of QD uptake by MSCs.
Note: Error bars represent the SD.
Abbreviations: MSCs, mesenchymal stem cells; PL, photoluminescence; QDs, quantum dots.
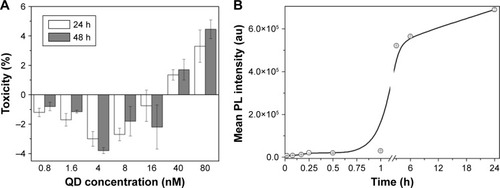
Figure 4 Confocal micrographs showing intracellular localization of QDs in MSCs.
Notes: Blue, nuclei (Hoechst); green, actin (Alexa Fluor 488® Phalloidin); red, QDs. Magnification 60×, scale bar 15 µm. White squares (a–d) mark the zoomed parts shown in the inserts. Inserts scale bar 10 µm.
Abbreviations: MSCs, mesenchymal stem cells; QDs, quantum dots.
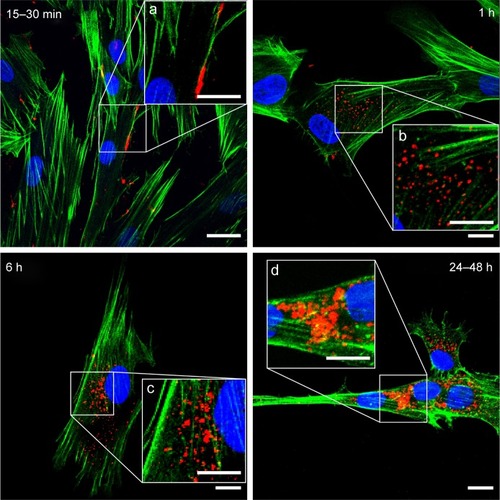
Figure 5 In vitro migration of MSCs.
Notes: MSCs (A) with QDs and (B) without QDs migrated through 8 µm pores toward a growth medium supplemented with 20% FBS. White arrows in (A) show some of the QDs. Cells were stained with Hoechst (nucleus stain); red, QDs. Magnification 10×, scale bar 200 µm. (C) MSC in vitro migration toward various chemoattractants. Error bars represent the SDs. Data were normalized according to the migration toward 20% FBS (positive control). p-values show significant differences compared to the negative control (FBS-free medium).
Abbreviations: FBS, fetal bovine serum; MSCs, mesenchymal stem cells; QDs, quantum dots.
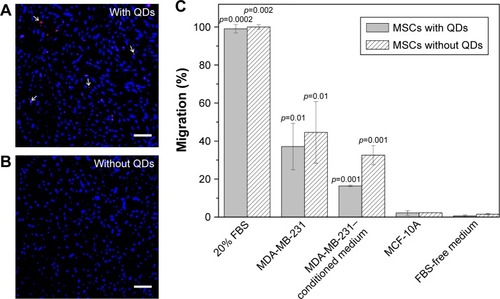
Figure 6 In vitro migration of MSCs extracted from three different donors.
Notes: (A) Migration of unlabeled MSCs. (B) Migration of QD-loaded MSCs. Data were normalized according to the migration toward 20% FBS (positive control). Error bars represent the SDs.
Abbreviations: FBS, fetal bovine serum; MSCs, mesenchymal stem cells; QDs, quantum dots.
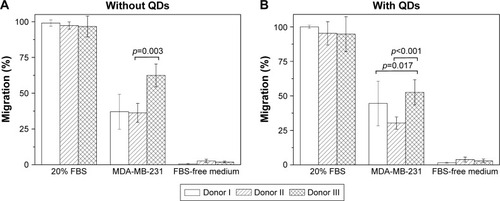
Figure 7 Micrographs showing QD-loaded MSCs in (A–C) tumor and (D–F) metastatic tissues. (A, D) PL, (B, E) PL and autofluorescence, (C, F) respective morphologic images (H&E staining).
Note: Scale bar 50 µm.
Abbreviations: H&E, hematoxylin and eosin; MSCs, mesenchymal stem cells; PL, photoluminescence; QDs, quantum dots.
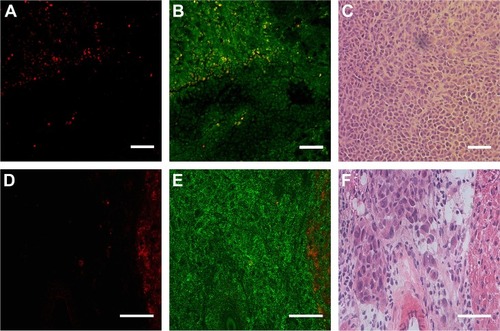
Figure 8 In vivo migration of QD-loaded MSCs.
Notes: (A) Flow cytometry dot plot showing tumor homogenate stained with anti-CD44. (B) Flow cytometry dot plot showing metastasis homogenate stained with anti-CD44. Q3 quadrant shows human cancer cells, Q4 shows mouse cells, Q2 shows QD-loaded MSCs. (C) QD-positive cells found in the respective tissues. p-values show significant differences between 24 h and 7 days.
Abbreviations: MSCs, mesenchymal stem cells; QDs, quantum dots.
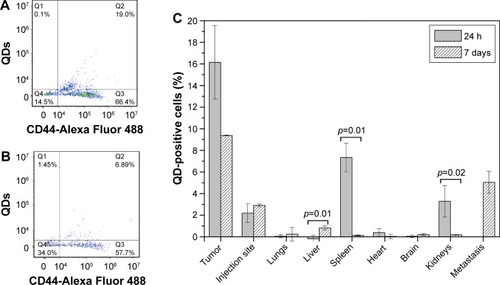
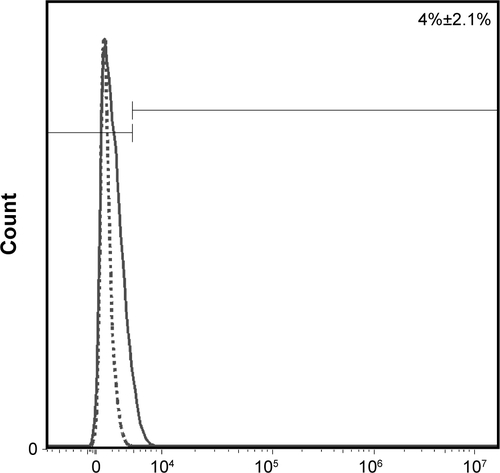
Figure S1 Flow cytometry histogram showing the amount of CXCR4 on the surface of skin-derived MSCs.
Notes: Dotted line, negative control; solid line, CXCR4-PE labeled MSCs. Percentage shows positive events.
Abbreviations: CXCR4, chemokine (C-X-C motif) receptor 4; MSCs, mesenchymal stem cells; PE, phycoerythrin.