Figures & data
Figure 1 Mean diameter of dodecylated chitosan–plasmid DNA nanoparticles at different charge ratios (A); Size and zeta potential of dodecylated chitosan-plasmid DNA nanoparticles (at charge ratio of 2:1) over a 7-day incubation period (B).
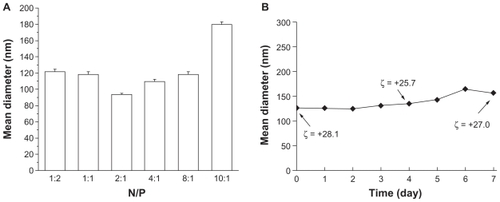
Figure 2 Agarose gel electrophoresis for analysis of CS/DNA (a) or DCS/DNA (b) complexes. Lane 1: plasmid DNA, Lane 2: N/P = 1:4, Lane 3: N/P = 1:2, Lane 4: N/P = 1:1, Lane 5: N/P = 2:1, Lane 6: N/P = 4:1, Lane 7: N/P = 8:1, Lane 8: N/P = 10:1.
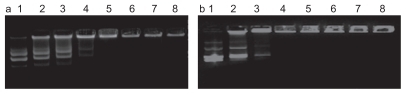
Figure 3 SEM images of DCDNPs-loaded stents. A) bare steel stent; B) bare steel stent at higher amplification; C) NP-stent; D) NP-stent at higher amplification before release test; E) NP-stent at higher amplification after release test.
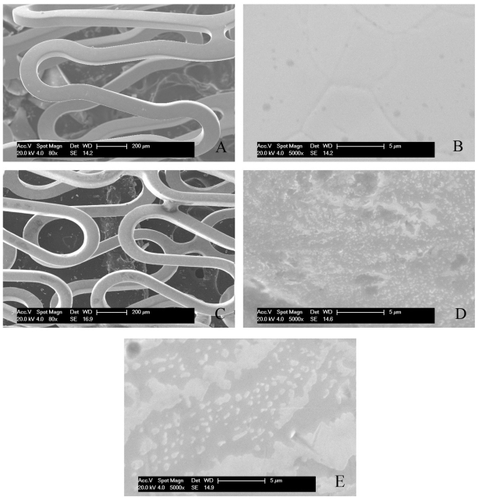
Figure 4 Plasmid DNA release profile from DCDNPs-loaded stents.
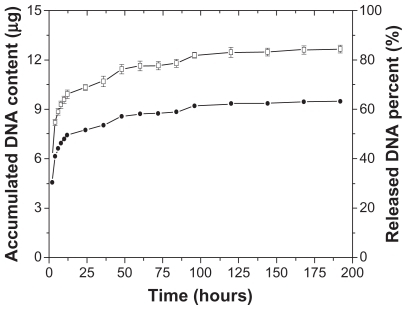
Figure 5 GFP expressions in A10 cells incubated with pEGFP-C1 loaded NP-stents. A) pEGFP-C1-loaded NP-stents; B) dodecylated chitosan-coating stent (no plasmid DNA) (FITC, 100×).
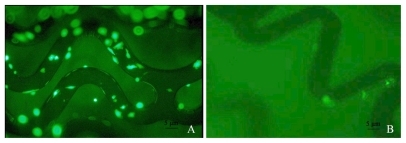
Figure 6 Rabbit CCA results demonstrating cells expressing GFP mediated by pEGFP-C1-loaded NP stents in vivo.
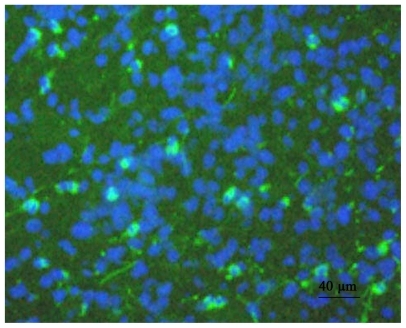
Figure 7 Rabbit CCA results demonstrating GFP transduction in arterial wall: A) Example of GFP expression following NP-stent implanting (FITC; 50×); B) Immunohistochemical confirmation of GFP expression (immunoperocidase; 50×).
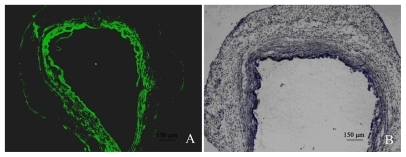
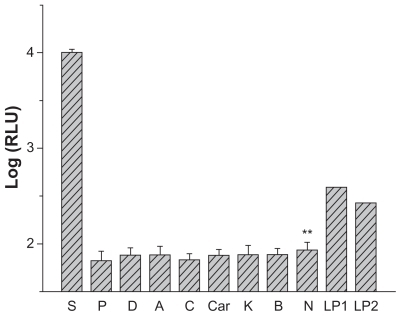
Figure 8 Relative luciferase expression of vessel wall and tissue samples (7 days after DCDNPs-loaded stents implanted).
Abbreviations: S, CCA with implanted stent; P, CCA proximal 3 cm; D, CCA distal 3 cm; A, abdominal aorta; C, contralateral CCA; Car, cardiac muscle; L, liver; K, kidney; B, encephalon; N, control artery; LP1, liver positive 1; LP2, liver positive 2.