
Figures & data
Figure 1 Expression of LOX in GC.
Notes: (A1 and A2) LOX expressed in cytoplasm of cancer cells (blue arrows) and stromal cells (red arrows) revealed by IHC. (B1 and B2) LOX was stained orange and expressed in cytoplasm of cancer cells (blue arrows) and stromal cells (red arrows) revealed by QDs-585-conjugated antibody nanoprobe. (C) LOX expressed in nucleus of cancer cells (green arrows) revealed by IHC. (D) LOX expressed in nucleus of tumor cells (green arrows) revealed by QDs-585 probe-based single molecular imaging. Magnification: 200× (A1, B1, C and D), 400× (A2 and B2), 100× (C and D). Scale bar: 50 μm for (A1 and B1), 20 μm for (A2 and B2) and 100 μm for (C and D).
Abbreviations: LOX, lysyl oxidase; GC, gastric cancer; IHC, immunohistochemistry; QD, quantum dot.
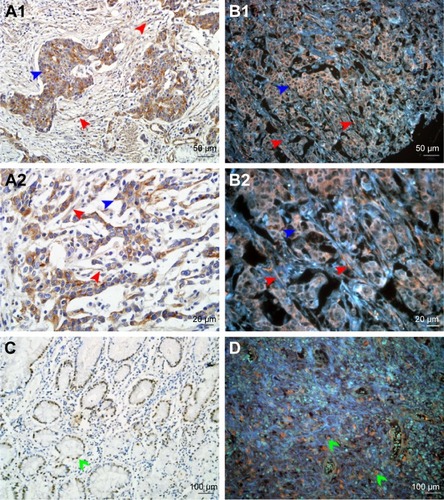
Figure 2 Comparison of conventional fluorescent dyes and QD-based molecular probe.
Notes: (A1) The expression of LOX in GC cells revealed by Cy3 fluorescent imaging (excited by 570 nm emission fluorescence, yellow arrows). Cell nuclei are indicated by green arrows. (A2) Cell nucleus revealed by DAPI (green arrows). Cytoplasms are indicated by yellow arrows. (A3) Merged imaging of A1 and A2; LOX expressed in GC cells (yellow arrows) and stromal cells (green arrows). (B1) The expression of LOX in GC revealed by DyLight 488 in GC cells (yellow arrows) and stromal cells (red arrows) (merged image). (B2 and B3) The LOX was stained red and expressed in GC cells (yellow arrows) and stromal cells (red arrows), which was revealed by QDs-655 imaging probes. (C1–C3) The LOX was stained yellow and expressed in GC cells (yellow arrows) and stromal cells (red arrows), which was revealed by QDs-585 imaging probes. Magnification: 200× (A1–A3, B1, B2 and C2), 400× (B3 and C3) and 100× (C1). Scale bar: 50 μm for (A1–A3, B1, B2 and C2), 20 μm for (B3 and C3) and 100 μm for (C1).
Abbreviations: QD, quantum dot; LOX, lysyl oxidase; GC, gastric cancer; DAPI, 4′,6-diamidino-2-phenylindole.
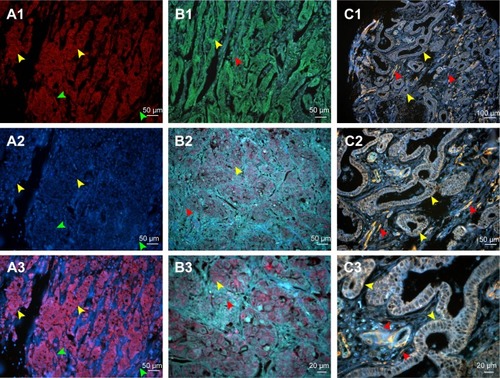
Figure 3 QD probe-based molecular imaging methods.
Notes: QD probe-based single molecular imaging. (A1) Type IV collagen was stained yellow by QDs-585-conjugated antibody nanoprobe (yellow arrow); the area that had been degraded was revealed (red arrow). (A2) Infiltrating macrophages were stained green by QDs-525-conjugated nanoprobe (green arrow). (A3) MMP-9 was stained red by QDs-655-conjugated nanoprobe (red arrow). (A4) MMP-9 is mainly expressed in the cytoplasm of cancer cells (red arrow) but not nuclear cells (blue arrow). QD probe-based double molecular imaging. (B1 and B2) Type collagen (yellow arrows) and MMP-9 (red arrows) are labeled simultaneously in GC tissues with nanoprobes QDs-585 and QDs-655, respectively. (B3 and B4) Type collagen (green arrows) and LOX (yellow arrows) are labeled simultaneously in GC tissues with nanoprobes QDs-525 and QDs-585, respectively. (C1–C4) Infiltrating macrophages (green arrows), LOX (yellow arrows) and neovessels (red arrows) are labeled simultaneously in GC tissues with nanoprobes QDs-525, QDs-585 and QDs-655, respectively. In C3, the expression of LOX was significantly higher than that in C2. Major vessels were microvessels. Magnification: 200× (A1, B1, B3, C2 and C3), 400× (A2, A3, B2, B4 and C4), 100× (C1) and 1,000× (A4). Scale bar: 50 μm for (A1, B1, B3, C2 and C3), 20 μm for (A2, A3, B2, B4 and C4), 100 μm for (C1) and 10 μm for (A4).
Abbreviations: QD, quantum dot; MMP-9, matrix metalloproteinase 9; GC, gastric cancer; LOX, lysyl oxidase.
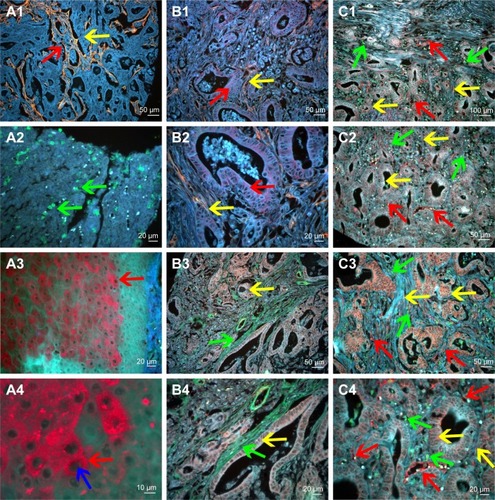
Figure 4 Multiplexed spectrum analysis of QD probe-based multiple molecular imaging.
Notes: (A1, B1, C1, D1, E1 and F1) The conventional fluorescent images of QD probe-based multiple molecular imaging. Infiltrating macrophages (green arrows), LOX (yellow arrows) and neovessels (red arrows) are labeled simultaneously in GC tissues with nanoprobes QDs-525, QDs-585 and QDs-655, respectively. (A2, B2, C2, D2, E2 and F2) Unmixed composite multiple spectrum image of QD probe-based multiple molecular imaging. Infiltrating macrophages (green arrows), LOX (yellow arrows) and neovessels (red arrows) are labeled simultaneously in GC tissues with nanoprobes QDs-525, QDs-585 and QDs-655, respectively. The unmixed composite multiple spectrum image shows more information. Magnification: 200× (A1–F2). Scale bar: 50 μm for (A1–F2).
Abbreviations: QD, quantum dot; LOX, lysyl oxidase; GC, gastric cancer.
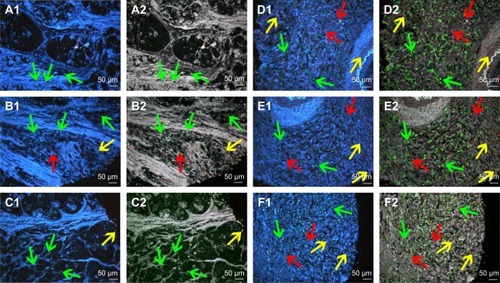
Table 1 Patient demographics and clinicopathologic characteristics
Table 2 Relationship between LOX expression and stromal parameters
Figure 5 QD probe-based molecular imaging showed the relationship between LOX and other stromal markers.
Notes: (A) The expression of LOX was low (yellow arrows), and the MVD (red arrows) was low. (B) The expression of LOX was high (yellow arrows), and the MVD (red arrows) was high. (C) The expression of LOX was high (yellow arrows), and the MVD (red arrows) and infiltrating macrophages (green arrows) were high. (D) The expression of LOX was low (yellow arrows), and type IV collagen (green arrows) was high. (E) The expression of LOX was high (yellow arrows), and type IV collagen (green arrows) was low. (F) The expression of LOX was high (yellow arrows) in the invasion front, and type IV collagen (green arrows) was low. Magnification: 200× (A–F). Scale bar: 50 μm for (A–F).
Abbreviations: QD, quantum dot; LOX, lysyl oxidase; MVD, microvessel density.
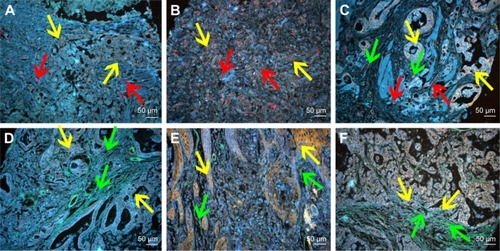
Table 3 Analyses of factors regarding OS
Table 4 Univariate and multivariate analyses of factors associated with OS and DFS
Figure 6 Cumulative OS and DFS curves of GC patients.
Notes: (A and B) LOX expression was related to the increased risk of death and recurrence for GC. (C and D) Stromal activation was related to the increased risk of death and recurrence for GC.
Abbreviations: OS, overall survival; DFS, disease-free survival; GC, gastric cancer; LOX, lysyl oxidase.
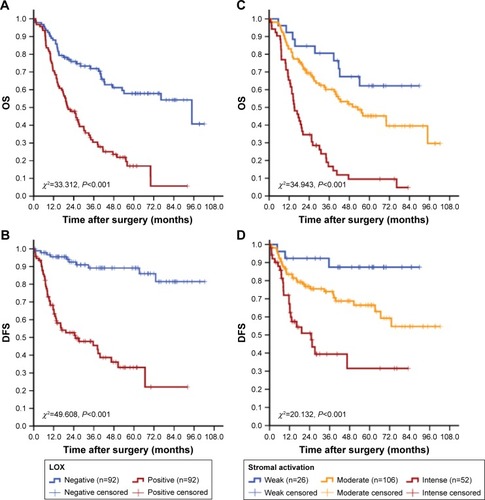
Table 5 Relationship between LOX expression and stromal parameters