Figures & data
Table 1 Parameters of the in vivo study
Table 2 Mean particle size and drug loading efficiency of Pae-NPs
Figure 1 Characterization of Pae-NPs.
Notes: (A) Size distribution of Pae-NPs measured by DLS. (B) Size changes of Pae-NPs at room temperature. (C) Cumulative release profile of Pae-NPs.
Abbreviations: Pae-NPs, Pae-loaded nanoparticles; DLS, dynamic light scattering.
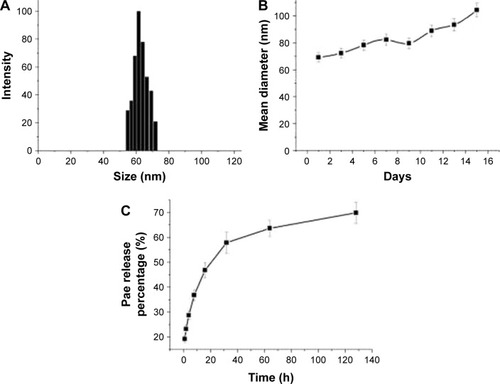
Figure 2 Dose-dependent cytotoxicity of Pae and Pae-NPs against (A) A549 and (B) NCI-H1975 cells.
Notes: Data are presented as mean ± SD (n=3). *p<0.05, **p<0.01, compared to the control group.
Abbreviations: Pae, paeonol; Pae-NPs, Pae-loaded nanoparticles; E-NPs, empty nanoparticles; SD, standard deviation.
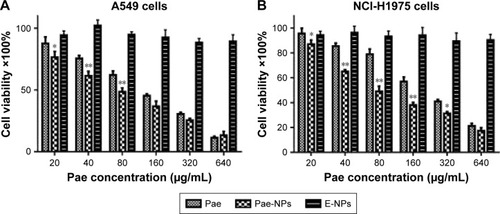
Figure 3 Cellular uptake of coumarin-6-loaded fluorescent Pae-NPs by cancer cells.
Notes: (A, B) Representative microscopic images of A549 cells incubated with coumarin-6-loaded Pae-NPs for 2 hours; (A) bright fields with higher magnification; (B) fluorescent fields with higher magnification. (C) Cellular uptake efficiency of Pae-NPs by A549 and NCI-H1975 cells. Data are presented as mean ± SD (n=3). **p<0.01, compared to the control group.
Abbreviations: Pae-NPs, Pae-loaded nanoparticles; SD, standard deviation.
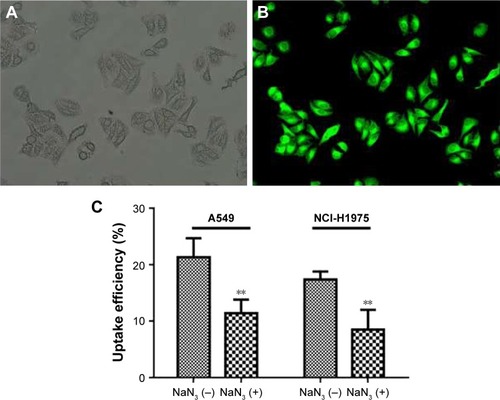
Figure 4 Effects of Pae and Pae-NPs on apoptosis in A549 cells without (A) or with (B) the presence of NAC.
Abbreviations: Pae, paeonol; Pae-NPs, Pae-loaded nanoparticles; E-NPs, empty nanoparticles; NAC, N-acetylcysteine; Con, control; FITC, fluorescein isothiocyanate; PI, propidium iodide.
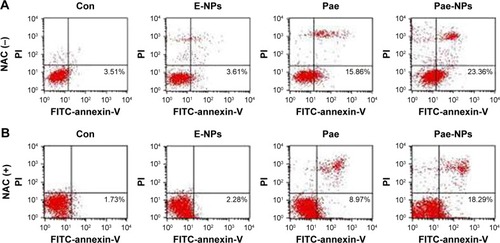
Figure 5 Detection of intracellular ROS.
Notes: (A) DHE fluorescence images of A549 cells treated with different agents (control; E-NPs; Pae [50 μg/mL]; Pae-NPs [at an equivalent dose of 50 μg/mL]). (B) Intracellular DHE fluorescence intensity. Data are represented as mean ± SD. *p<0.05, compared to the control group; #p<0.05, compared to the Pae group or Pae-NPs group.
Abbreviations: Pae, paeonol; Pae-NPs, Pae-loaded nanoparticles; E-NPs, empty nanoparticles; SD, standard deviation; DHE, dihydroethidium; ROS, reactive oxygen species; NAC, N-acetylcysteine; Con, control.
![Figure 5 Detection of intracellular ROS.Notes: (A) DHE fluorescence images of A549 cells treated with different agents (control; E-NPs; Pae [50 μg/mL]; Pae-NPs [at an equivalent dose of 50 μg/mL]). (B) Intracellular DHE fluorescence intensity. Data are represented as mean ± SD. *p<0.05, compared to the control group; #p<0.05, compared to the Pae group or Pae-NPs group.Abbreviations: Pae, paeonol; Pae-NPs, Pae-loaded nanoparticles; E-NPs, empty nanoparticles; SD, standard deviation; DHE, dihydroethidium; ROS, reactive oxygen species; NAC, N-acetylcysteine; Con, control.](/cms/asset/f70a07fb-ed27-461a-9b8b-e0b0b656f67a/dijn_a_12193775_f0005_c.jpg)
Figure 6 Effects of free Pae or Pae-NPs on the expression of Akt pathway proteins in A549 cells.
Notes: (A) Blots of p-Akt and Akt from cells treated with different agents. (B) Semi-quantification of protein expression. Data are represented as mean ± SD.
Abbreviations: Pae, paeonol; Pae-NPs, Pae-loaded nanoparticles; E-NPs, empty nanoparticles; SD, standard deviation; NAC, N-acetylcysteine; Con, control.
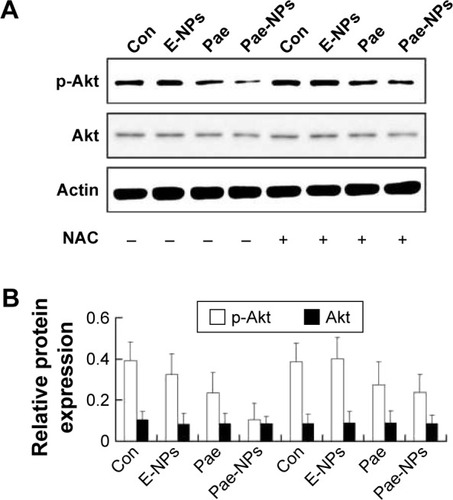
Figure 7 Effect of free Pae or Pae-NPs on the expression of apoptotic proteins in A549 cells.
Notes: (A) Blots of Bcl-XL, Bax, and Bcl-2 from cells treated with different agents. (B) Semi-quantification of protein expression. Data are represented as mean ± SD.
Abbreviations: Pae, paeonol; Pae-NPs, Pae-loaded nanoparticles; E-NPs, empty nanoparticles; SD, standard deviation; NAC, N-acetylcysteine; Con, control.
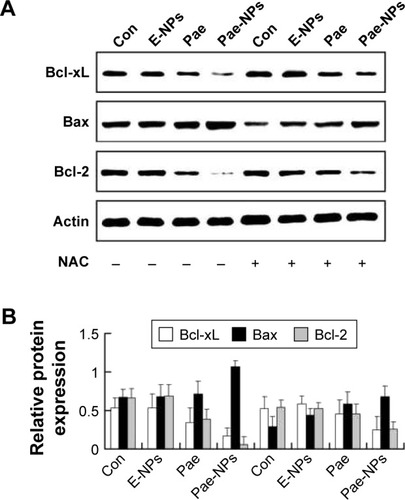
Figure 8 Effect of free Pae or Pae-NPs on the expression of caspase-3 and cleaved caspase-3 proteins in A549 cells.
Notes: (A) Blots of caspase-3 and pro-caspase-3 from cells treated with different agents. (B) Semi-quantification of protein expression. Data are represented as mean ± SD.
Abbreviations: Pae, paeonol; Pae-NPs, Pae-loaded nanoparticles; E-NPs, empty nanoparticles; SD, standard deviation; NAC, N-acetylcysteine; Con, control.
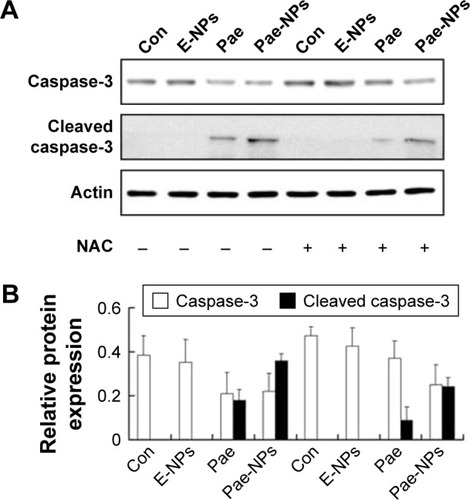
Figure 9 In vivo antitumor efficacy of Pae-NPs.
Notes: The mice were intravenously administered with PBS, E-NPs, free Pae, or Pae-NPs every 2 days for three consecutive injections. (A) Growth inhibition study in the A549 xenograft model. (B) Body weight changes for the tumor bearing mice after various formulations were given to mice on the indicated days. Data are represented as mean ± SD (n=6). *p<0.05, **p<0.01, compared to the control group; #p<0.05, compared to the Pae group.
Abbreviations: Pae, paeonol; Pae-NPs, Pae-loaded nanoparticles; E-NPs, empty nanoparticles; SD, standard deviation; PBS, phosphate-buffered saline; Con, control.
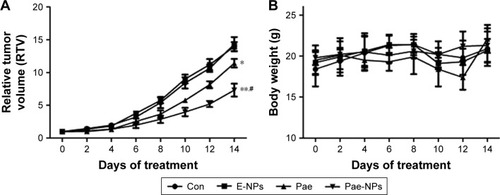
Figure S1 Uptake efficiency of Pae-NPs and free Pae by two kinds of lung cancer cells (n=3; ***p<0.001).
Abbreviations: Pae, paeonol; Pae-NPs, Pae-loaded nanoparticles.
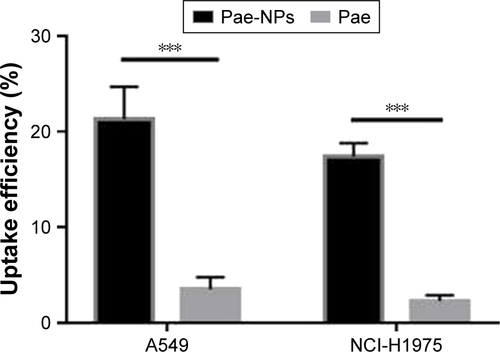
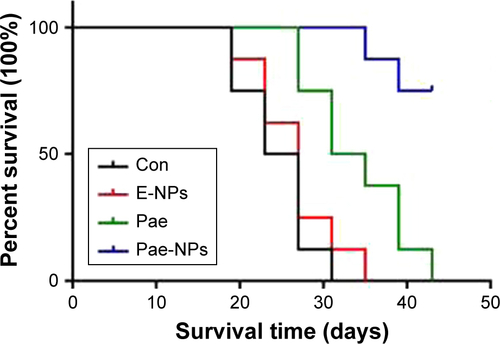
Figure S2 Kaplan–Meier curves showing the survival of xenograft mice treated with different protocols. (Log-rank test; p<0.0001).
Abbreviations: Pae, paeonol; Pae-NPs, Pae-loaded nanoparticles; E-NPs, empty nanoparticles; Con, control.