Figures & data
Figure 1 Preparation of liposomes coupled with anti-VEGF2. (A) Schematic illustration of the coupling of anti-VEGF2 to liposomes via maleimide-thiol reaction. (B) Particle size distribution of liposomes with anti-VEGF2. (C) TEM examination revealed a uniform spherical shape for the liposomes coupled with anti-VEGF2 (magnification ×5,000).
Abbreviations: Diam, diameter; Mal, maleimide; SPDP, N-succinimidyl-3-(2-pyridyldithio)propionate; TEM, transmission electron microscopy; VEGF2, vascular endothelial growth factor 2; WT, wild type.
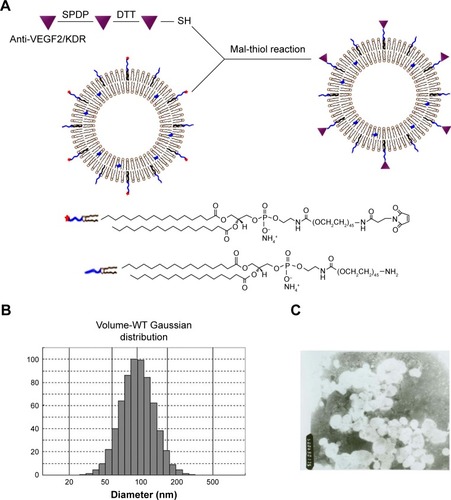
Figure 2 Characterization of HECs. (A) Morphology of HECs. (B) Immunocytochemistry showed that the cell cultures were positive for factor VIII. (C) Reverse transcription PCR analysis demonstrated that the isolated cells expressed factor VIII and VEGF2 mRNA. Bar =50 μm.
Abbreviations: HEC, hemangioma endothelial cell; PCR, polymerase chain reaction; VEGF2, vascular endothelial growth factor 2.
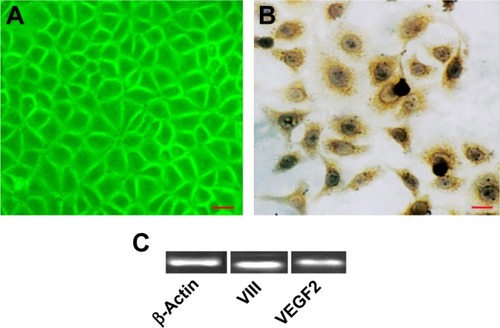
Figure 3 Morphological characteristics of HECs (microscope and Giemsa staining). (A) Control group; (B and F) sodium morrhuate group; (C and G) blank liposome group; (D and H) liposomal sodium morrhuate group; (E and I) sodium morrhuate immunoliposome group. Scale bars =50 μm.
Abbreviation: HEC, hemangioma endothelial cell.
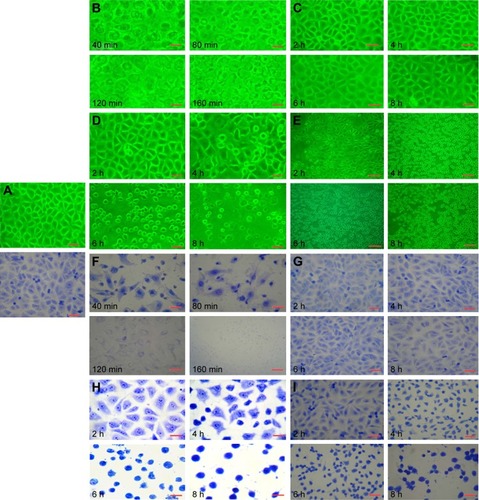
Figure 4 Confocal microscopy reveals the targeting of sodium morrhuate immunoliposomes to HECs. (A and a) Control group; (B and b) liposomal sodium morrhuate group; (C and c) sodium morrhuate immunoliposomes group. Scale bars =50 μm.
Abbreviation: HEC, hemangioma endothelial cell.
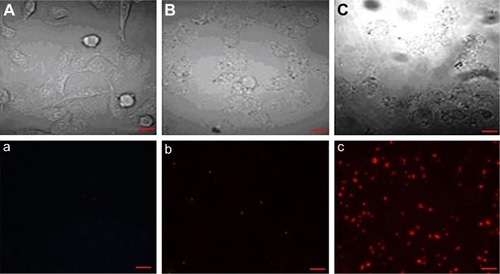
Figure 5 HECs were treated with indicated agents for different times and tested for viability by MTT assay.
Abbreviations: HEC, hemangioma endothelial cell; MTT, 3-[4, 5-dimethyl-2-thiazolyl]-2, 5-diphenyl-2H-tetrazolium bromide; OD, optical density; SM, sodium morrhuate.
![Figure 5 HECs were treated with indicated agents for different times and tested for viability by MTT assay.Abbreviations: HEC, hemangioma endothelial cell; MTT, 3-[4, 5-dimethyl-2-thiazolyl]-2, 5-diphenyl-2H-tetrazolium bromide; OD, optical density; SM, sodium morrhuate.](/cms/asset/b14c01b2-f099-42d1-8bf9-df500de72da4/dijn_a_12193778_f0005_c.jpg)
Figure 6 Apoptosis analysis by flow cytometry. (A) Control group; (B) liposomal sodium morrhuate group; (C) sodium morrhuate immunoliposomes group; (D) quantification of apoptosis.
Note: The sample number is show above each analysis.
Abbreviations: Li, liposome; SM, sodium morrhuate.
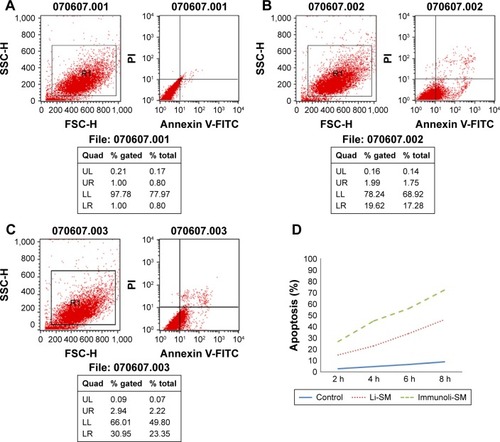
Figure 7 TEM examination of HECs treated with indicated agents. (A and B) Sodium morrhuate group (×10,000); (C) liposomal sodium morrhuate group (×4,000); (D) sodium morrhuate immunoliposome group (×4,000); (E) control group (×4,000).
Abbreviations: HEC, hemangioma endothelial cell; TEM, transmission electron microscopy.
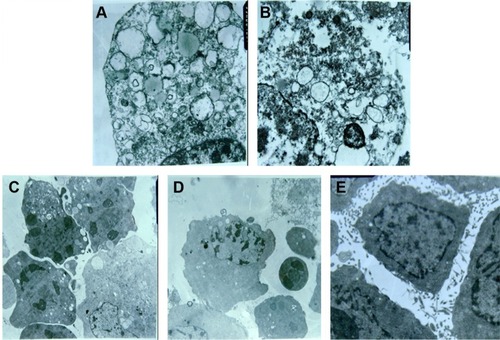
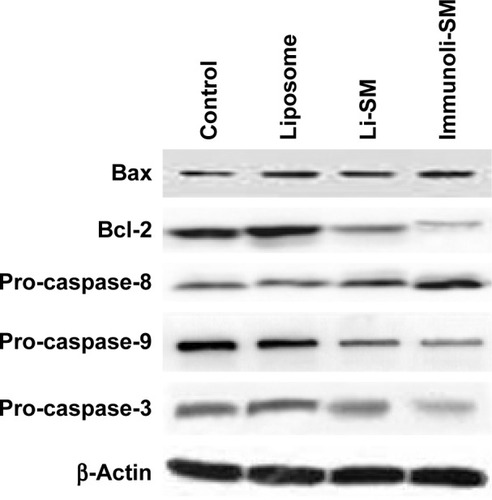
Figure 8 Western blot analysis of indicated proteins from different groups. Representative blots of three independent experiments with similar results are shown.
Abbreviations: Li, liposome; SM, sodium morrhuate.