Figures & data
Figure 1 The interactions of PTX-Rq-heparin based on molecular simulations.
Notes: (A) The binding conformation of PTX and Rq after 20 ns simulation using Gromacs. (B) The binding conformation of PTX, Rq, and heparin after 20 ns simulation using Gromacs. PTX is indicated in green, the cell penetrating group of Rq in red, the affinity group of Rq in blue, and heparin in purple.
Abbreviations: Arg, arginine; PTX, paclitaxel; RMSD, root mean square deviation; Rq, RRRRQWWQW.
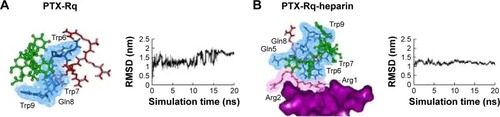
Figure 2 The cytotoxic effects of Rq on the cell viability of HeLa.
Note: The cell viability after incubation with different concentrations of Rq for 3 hours (A) and with 100 or 1,000 μM Rq for 24 hours (B).
Abbreviation: Rq, RRRRQWWQW.
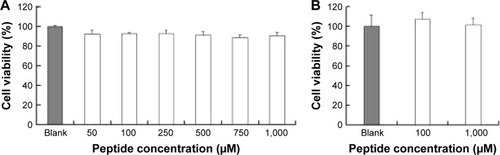
Figure 3 Intracellular uptake of Rq.
Notes: HeLa cells were incubated with Rq-FITC at the concentration of 10 μM and 100 μM for 30 minutes, respectively. (A) Visualization of the translocation of various concentrations of Rq-FITC. Scale bar =50 μM and the scale bar in the bottom right corner applies to all images. Fluorescence was observed using a fluorescence microscope. (B) Flow cytometric analyses of the cells containing Rq-FITC. (C) Representative results of FACS. Asterisk ‘**’ indicates the significant difference relative to the FITC group in the same concentration, p,0.01. (D) The intracellular accumulation of Rq-FITC over time and its distribution. Fluorescence was observed using a confocal microscope. Scale bar =10 μM.
Abbreviations: DAPI, 4′,6-diamidino-2-phenylindole; FACS, fluorescence activated cell sorting; FITC, fluorescein isothiocyanate; Rq, RRRRQWWQW.
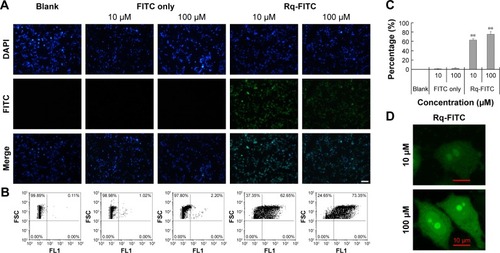
Figure 4 The cytotoxicity of Rq/PTX.
Notes: (A) Effects of Rq concentrations on the cell viability of HeLa. The cell viability after 24 hours culture in the normal culture medium following 30 minutes exposure to 1.47 μg/mLPTX with different concentrations of Rq. (B) Effects of PTX concentrations on the cell viability of HeLa. The cell viability after 24 hours culture in the normal culture medium following 30 minutes exposure to 100 μM Rq with different concentrations of PTX. (C) The cytotoxicity of Rq/PTX with various incubation times. The cell viability after 24 hours culture in the normal culture medium following treatments with Rq (10 μM)/PTX (1.47 μg/mL) for 30 seconds, 1 minute, 5 minutes, 30 minutes, and 24 hours, respectively. (D) The intracellular concentration of PTX with 30 minutes treatment of Rq (100 μM)/PTX (1.47 μg/mL). All comparisons were made relative to the free PTX group and the significance of the difference was indicated as *p<0.05 or **p<0.01.
Abbreviations: PTX, paclitaxel; Rq, RRRRQWWQW.
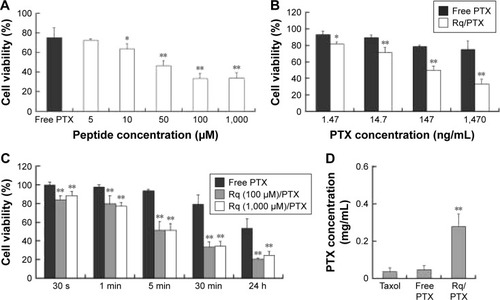
Figure 5 Microtubule immunofluorescence analysis.
Notes: HeLa cells were treated with Rq (10 μM)/PTX (1.47 μg/mL). (A) Visualization of the microtubule immunofluorescence in HeLa cells. Fluorescence was observed using a confocal microscope. Scale bar =10 μM and the scale bar in the bottom right corner applies to all images. (B) The histogram for the FACS analysis of fluorescence intensity. The group of untreated cells is indicated in red, the group of cells treated with free PTX group of Rq in blue, and the group of cells treated with free PTX and Rq in green.
Abbreviations: FACS, fluorescence activated cell sorting; PTX, paclitaxel; Rq, RRRRQWWQW.
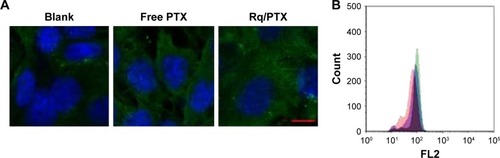
Figure 6 The cellular uptake of Rq after treatments of low temperature (4°C), ATP depletion, or endocytosis inhibitors.
Notes: Relative cell viability after incubation with Rq (10 μM)/PTX (A) and Rq (100 μM)/PTX (B) under different inhibition conditions. The cells treated with Rq/PTX only were used as the control and the results are presented as percentage of the control value (100%).
Abbreviations: CPZ, chlorpromazine; Nys, nystatin; PTX, paclitaxel; Rq, RRRRQWWQW.
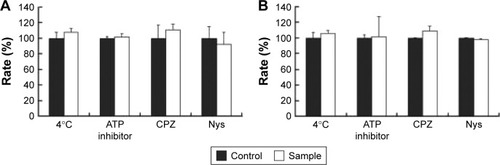
Figure 7 In vivo antitumor analysis of Rq/PTX.
Notes: (A) The PTX concentrations in plasma for different time courses. (B) The PTX concentrations in different tissues. (C) Tumor volume changes after treatment with PBS, free PTX, Taxol, and Rq/PTX, respectively. Error bars represent ± SD (n=5). (D) Body weights of tumor bearing BALB/c mice. (E) HE staining of major organs (ie, liver, heart, lung, kidney, and spleen) separated from the mice injected intravenously with PBS, free PTX, Taxol, and Rq/PTX, respectively. Scale bar =50 μM and the scale bar in the bottom right corner applies to all images. All comparisons were made relative to the free PTX group and the significance of the difference was indicated as *p<0.05 and **p<0.01.
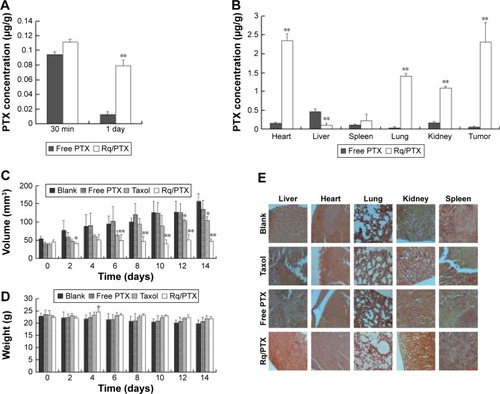
Figure S1 Interactions of PTX-peptide based on molecular simulation.
Notes: The binding conformation of PTX and RRRRRWWQY (A), PTX and RRRRQWWPY (B), PTX and RRRRRWWWW (C), and PTX and RRRRQWWYW (D) after 20 ns simulation using Gromacs. PTX is indicated in green, the cell penetrating group of peptides in red, the affinity group of peptides in blue. The four candidates RRRRQWWPY, RRRRRWWWW, RRRRRWWQY, and RRRRQWWYW interacted with PTX by the cell penetrating sequence rather than that with the affinity sequence. Meanwhile, RRRRRQWWW and RRRRQWWWP could not bind to PTX (data not shown). Thus, these peptides were eliminated from the candidate list for further experiments.
Abbreviations: Arg, arginine; PTX, paclitaxel.
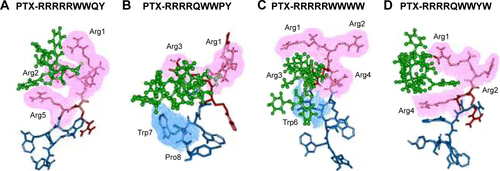
Figure S2 Cytotoxicity of Rq and Rq/PTX on the cell viability of L292 cells, HCT cells, A594 cells, Hep-G2 cells, and HSC cells.
Notes: (A) Cell viability after incubation with 1,000 μM Rq for 24 hours. (B) Cell viability after 24 hours culture in the normal culture medium following 30 minutes exposure to 100 μM Rq with 1.47 μg/mL PTX. The free PTX group was used as control. **Significant difference relative to the FITC group in the same concentration, p<0.01
Abbreviations: DMEM, Dulbecco’s Modified Eagle’s Medium; FBS, fetal bovine serum; PTX, paclitaxel; Rq, RRRRQWWQW.
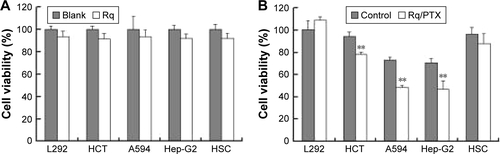
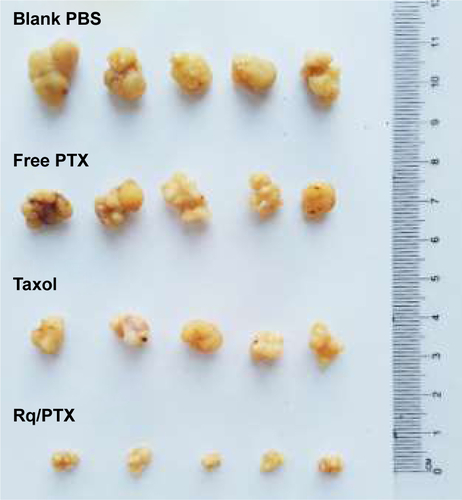
Figure S3 Photo images of the tumor separated from mice after treatment for 14 days.
Notes: The significant difference in the tumor volume among the blank, free PTX group, and Taxol to Rq/PTX group revealed that significant inhibition of tumor growth was essentially ascribed to efficient PTX delivery by the help of Rq.
Abbreviations: PBS, phosphate-buffered solution; PTX, paclitaxel; Rq, RRRRQWWQW.