Figures & data
Figure 1 General scheme of the whole-cell bioluminescence biosensor for detection of oligomerization.
Note: Schematic representation explains split-luciferase strategy for monitoring of A53T αS oligomerization and using of this system for screening of GQDs effect on A53T αS oligomerization.
Abbreviations: αS, alpha-synuclein; PEI, polyethylenimine; GQDs, graphene quantum dots.
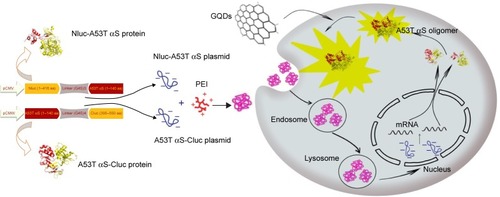
Figure 2 General scheme of different plasmid constructs.
Notes: Nluc-A53T αS: the N-terminal fragment of firefly luciferase (1–416 amino acids) connected to N-terminus of A53T αS through (G4S)3 flexible linker; Cluc-A53TαS: the C-terminal fragment of firefly luciferase (395–550 amino acids) connected to N-terminus of A53T αS through (G4S)4 flexible linker under the control of the CMV promoter; A53T αS-Cluc: the C-terminus of A53T αS connected to C-terminal fragment of firefly luciferase (395–550 amino acids) through (G4S)4 linker.
Abbreviation: αS, alpha-synuclein.
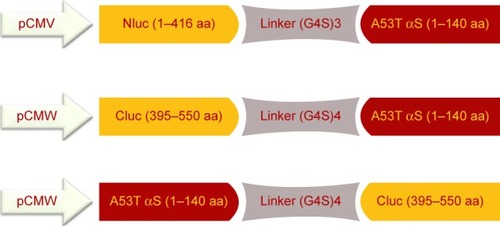
Figure 3 (A) Split-luciferase complementation assay for detection of A53T αS oligomers. We generated split Nluc-A53T αS and Cluc-A53T αS fragments. Once A53T αS formed oligomer, split firefly luciferase proteins were reconstituted which showed luminescence. (B) Comparison of luciferase activity upon transient transfection of firefly luciferase, Nluc, Cluc, Nluc-A53T αS, Cluc-A53T αS, double (Nluc and Cluc) and (Nluc-A53T αS and Cluc-A53T αS) plasmids into HEK293T cells. Luminescence from transfected HEK293T cells after double transfection of Nluc-A53T αS and A53T αS-Cluc was not observed. The luminescence ± SD in three independent experiments are shown.
Abbreviations: αS, alpha-synuclein; RLU, relative light units.
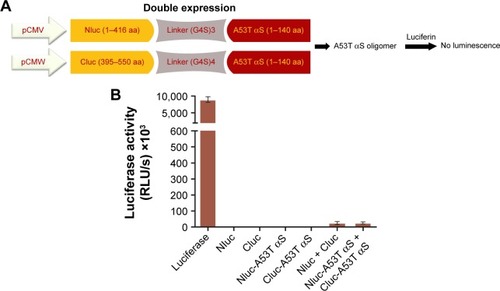
Figure 4 Detection of A53T αS dimer/oligomers using split-luciferase complementation assay.
Notes: (A) Scheme of split-luciferase complementation assay for detection of A53T αS oligomers. We generated split Nluc-A53T αS and A53T αS-Cluc fragments. Once A53T αS formed oligomer, split firefly luciferase proteins were reconstituted which showed luminescence. (B) Transient transfection of firefly luciferase, Nluc, Cluc, Nluc-A53T αS, A53T αS-Cluc, double (Nluc and Cluc) and (Nluc-A53T αS and A53T αS-Cluc) plasmids into HEK293T cells and comparison of luciferase activity. Luminescence from transfected HEK293T cells after double transfection of Nluc-A53T αS and A53T αS-Cluc was observed. The luminescence ± SD in three independent experiments are shown.
Abbreviations: αS, alpha-synuclein; RLU, relative light units.
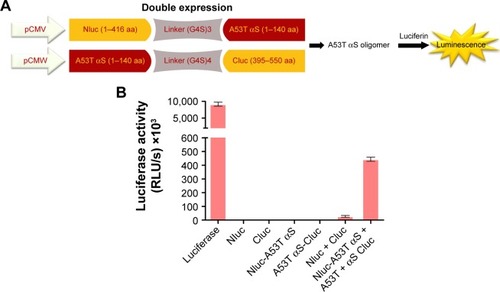
Figure 5 Cell toxicity assay of GQDs and GOQDs.
Notes: Viability percentage of the HEK293T cells following exposure to the increasing concentration of GQDs (pink bars) and GOQDs (blue bars). The bar labeled as “Con” represents the viability of the cells maintained under the same conditions and without any treatment. The bar labeled as “DOX” represents the viability of the cells treated by doxorubicin. Each experiment was conducted three times.
Abbreviations: GQDs, graphene quantum dots; GOQDs, graphene oxide quantum dots.
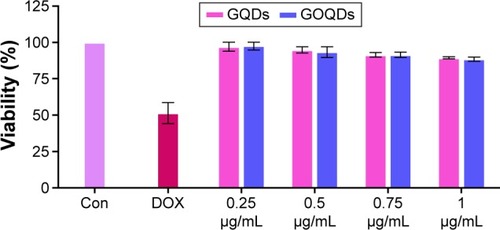
Figure 6 The effect of different nanomaterials on A53T αS oligomerization monitored by the whole-cell biosensor.
Notes: The luminescence ± SD in three independent experiments are shown. **p<0.01 and ***p<0.001.
Abbreviations: αS, alpha-synuclein; RLU, relative light units; GQDs, graphene quantum dots; GOQDs, graphene oxide quantum dots.
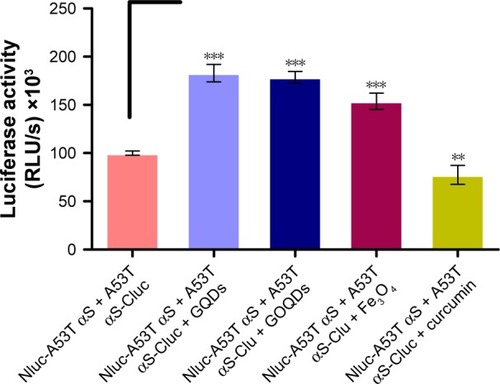
Figure 7 Characterizations of GQDs.
Notes: (A) UV/visible and (B) fluorescence spectra of GQDs. (C) Photo of dispersed GQDs under 365 nm UV lamp. From left to right: 1 mg/mL of GQDs in PBS, 0.01 mg/mL of GQDs in PBS, and PBS. (D) AFM image of GQDs.
Abbreviations: GQDs, graphene quantum dots; PBS, phosphate-buffered saline; AFM, atomic force microscopy.
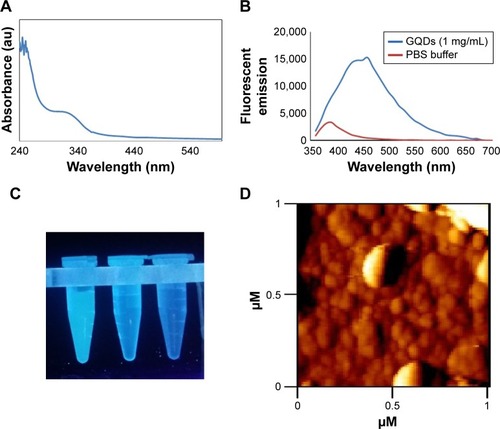
Figure 8 The effect of nanomaterials on A53T αS in vitro aggregation.
Notes: (A) General scheme of A53T αS aggregation in the presence of GQDs and GOQDs. (B) The percentage of A53T αS aggregation with different nanomaterials (50 μg/mL) and 25 μM of curcumin compared to the control (A53T αS) after 48 hours of incubation under aggregation condition. Each experiment was conducted three times. ***p<0.001.
Abbreviations: αS, alpha-synuclein; GQDs, graphene quantum dots; GOQDs, graphene oxide quantum dots; NPs, nanoparticles.
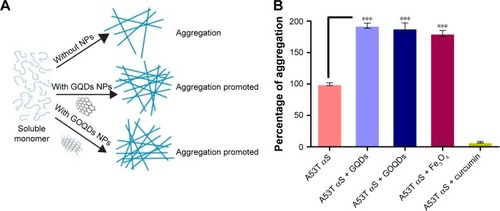
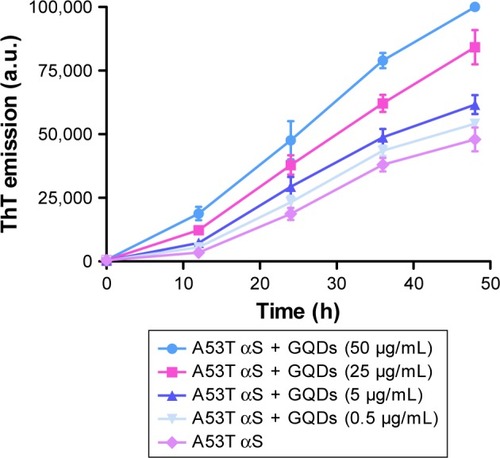
Figure 9 Aggregation kinetics of A53T αS (50 μM) in the presence of different concentrations (50, 25, 5 and 0.5 μg/mL) of GQDs.
Notes: ThT fluorescence was plotted as a function of time at 37°C in PBS (pH 7.4). The values represent the mean ± SD; means were obtained for three separate experiments (n=3).
Abbreviations: GQDs, graphene quantum dots; ThT, thioflavin T; PBS, phosphate-buffered saline; αS, alpha-synuclein.