
Figures & data
Figure 1 TEM image of AuNPs dispersed on the surface of MoS2.
Abbreviations: AuNP, gold nanoparticle; MoS2, molybdenum disulfide; TEM, transmission electron microscopy.
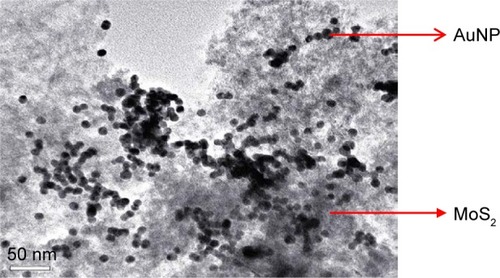
Figure 2 The fluorescence intensity of FAM-modified aptamer (10 nM) in the presence of various concentrations (0, 10, 15, 20, 25, 30, 40, and 50 μg/mL) of AuNPs@MoS2 nanocomposites.
Abbreviations: AuNPs, gold nanoparticles; MoS2, molybdenum disulfide; FAM, carboxyfluorescein.
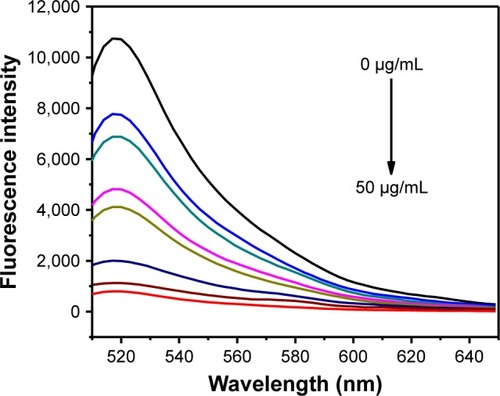
Figure 3 (A) The fluorescence intensity of FAM-modified aptamer (10 nM) in the presence of AuNPs@MoS2 nanocomposites (40 μg/mL) with varying concentrations of thrombin (0.03 pM, 0.04 pM, 0.05 pM, 0.06 pM, 0.4 pM, 0.6 pM, 0.8 pM, 1.2 pM, 4 pM, 5 pM, 60 pM, and 120 pM) and (0.03 UμL-1) Exo. (B) The values of [F/F0-1] for assay with the concentration of thrombin are shown.
Note: All data were collected from three measurements, and the error bars indicate the standard deviation.
Abbreviations: AuNPs, gold nanoparticles; MoS2, molybdenum disulfide; Exo, exonuclease; FAM, carboxyfluorescein; F0, values of fluorescence intensities without thrombin; F, values of fluorescence intensities with thrombin.
![Figure 3 (A) The fluorescence intensity of FAM-modified aptamer (10 nM) in the presence of AuNPs@MoS2 nanocomposites (40 μg/mL) with varying concentrations of thrombin (0.03 pM, 0.04 pM, 0.05 pM, 0.06 pM, 0.4 pM, 0.6 pM, 0.8 pM, 1.2 pM, 4 pM, 5 pM, 60 pM, and 120 pM) and (0.03 UμL-1) Exo. (B) The values of [F/F0-1] for assay with the concentration of thrombin are shown.Note: All data were collected from three measurements, and the error bars indicate the standard deviation.Abbreviations: AuNPs, gold nanoparticles; MoS2, molybdenum disulfide; Exo, exonuclease; FAM, carboxyfluorescein; F0, values of fluorescence intensities without thrombin; F, values of fluorescence intensities with thrombin.](/cms/asset/fcdc3f6a-3766-4243-9b09-775e86cd51a5/dijn_a_12193800_f0003_c.jpg)
Table 1 Comparison of different methods for thrombin detection
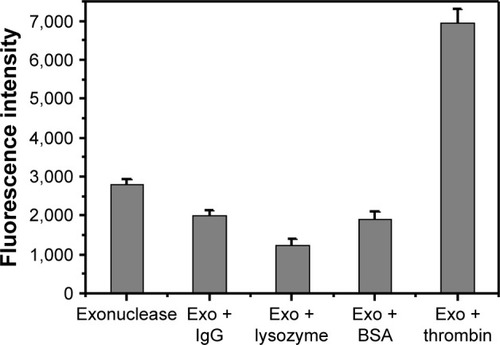
Figure 4 The fluorescence intensity of FAM-modified aptamer (10 nM)-MoS2 (40 μg/mL) in the presence of other proteins (BSA, IgG, and lysozyme) at the concentration of 0.001 nM.
Abbreviations: BSA, bovine serum albumin; Exo, exonuclease; FAM, carboxyfluorescein; IgG, immunoglobulin G; MoS2, molybdenum disulfide.
Scheme 1 The strategy for the aptamer–MoS2 biosensor based on FRET to detect thrombin.
Abbreviations: FRET, fluorescence resonance energy transfer; MoS2, molybdenum disulfide; AuNPs, gold nanoparticles.
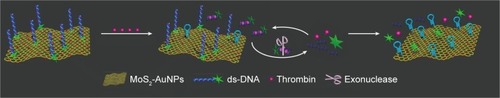
Table 2 Results for the determination of thrombin in human blood serum