Figures & data
Figure 1 A typical TEM micrograph of 3MPA-QDs.
Abbreviations: TEM, transmission electron microscopy; 3MPA-QD, 3-mercaptopropionic acid-coated CdSe-CdS/ZnS core-multishell quantum dot.
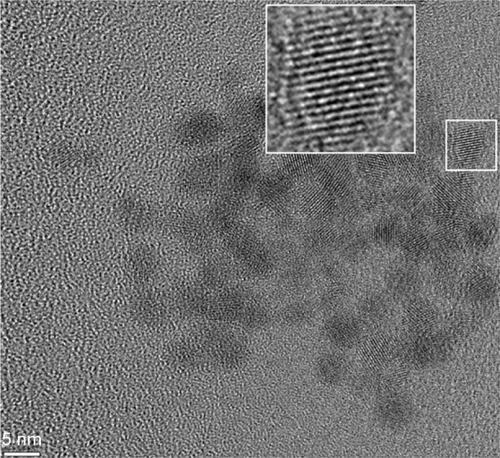
Figure 2 Membrane attachment, aggregation and movement of QDs.
Notes: (A–F) Orthogonal merged QD fluorescence (pseudocolor yellow) and bright-field images (image sizes = 54×54×22 µm3) showing membrane attachment of 3MPA-QDs in a single HUVEC cell. In all, 20 µL of 5 µM QD solution was deposited to a 35 mm µ-dish with 1.5 mL growth medium. QDs were first sedimented to cell surface and then aggregated iñ20–25 min. (G–I) Temporal xy distribution of QD fluorescence (integrated over z, red = high intensity, blue = zero intensity) showing gradual aggregation of QDs and their movements on the cell surface, as shown in E and F (image sizes =54×54 µm2). The horizontal dashed line and arrow heads mark one stationary QD aggregate on the dish bottom. Notice the gradual increase in the fluorescence intensity due to continuous QD sedimentation. The same QD aggregate shown in I and F marked by a vertical arrow head is located above the cell. (J) Fluorescence spectra of QD aggregates obtained using lambda-mode scan. Red lines: four QD aggregates on cell membrane as confirmed by the simultaneous detection of autofluorescence signal. Black lines: two QD aggregates on the petri dish bottom showing no simultaneous detection of autofluorescence signal due to the lack of contact with the cell.
Abbreviations: QD, quantum dot; 3MPA-QD, 3-mercaptopropionic acid-coated CdSe-CdS/ZnS core-multishell quantum dot; HUVEC, human umbilical vein endothelial cell.
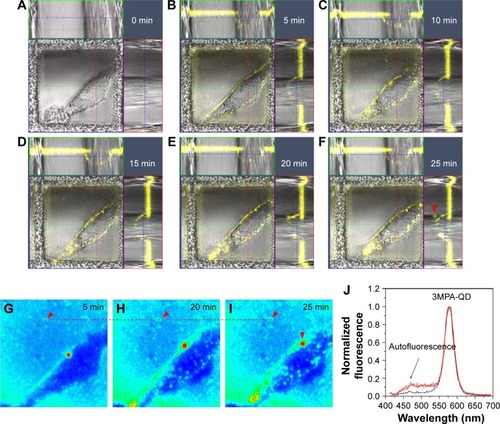
Figure 3 QD cell internalization at 24 h and extrusion after 48 h.
Notes: (A–D) QD distributions (yellow) in HUVECs 24 and 48 h after QD deposition. (E) QD fluorescence intensity vs number of pixels. The difference between the two fluorescence intensity curves underlines that QDs were released into the culture medium after 48 h. (F–H) QDs found in the culture medium after 48 h.
Abbreviations: QD, quantum dot; HUVEC, human umbilical vein endothelial cell; W, water lens.
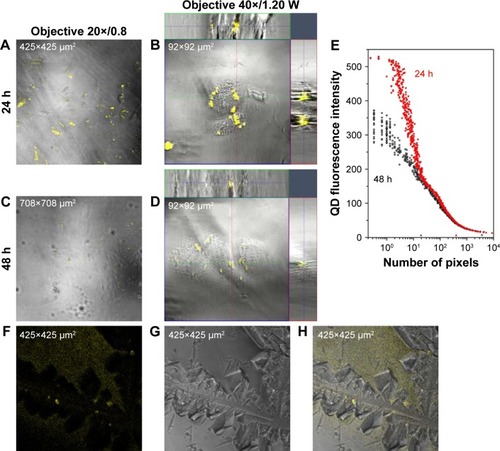
Figure 4 Apoptosis in HUVECs detected by immunofluorescence using Annexin V-FITC Apoptosis Detection Kit.
Notes: Untreated control cells (A) and cells exposed to QDs for (B) 2 h, (C) 24 h and (D) 48 h show sporadic apoptosis (yellow arrows). Observation area =3,399×425 µm2. Red = PI (late apoptosis), green = Annexin V-FITC (apoptosis onset) and blue = Hoechst (nuclei).
Abbreviations: HUVEC, human umbilical vein endothelial cell; QD, quantum dot; PI, propidium iodide.
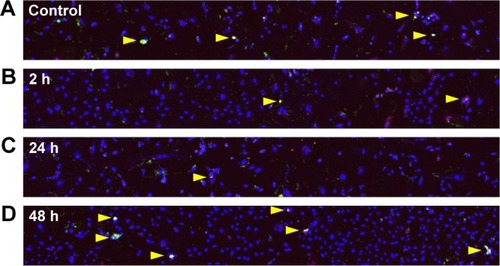
Figure 5 Wound healing process of control and 3MPA-QD-treated HUVECs (incubated with 3MPA-QDs for 1 h, medium changed and further incubated for another 23 h so that 3MPA-QDs were internalized).
Notes: (A) HUVEC distribution directly and (B) 7.5 h after the mechanical scratch. Image sizes =850×850 µm2. (C and D) Statistical cell distributions of control and 3MPA-QD-treated HUVECs in the sections along the x-axis (B) at different time points (time interval 1.25 h) averaged over micrographs acquired along the vertical scratches. Red, orange, yellow, green, cyan, blue, and purple lines mark the time points of 0, 1.25, 2.5, 3.75, 5, 6.25, and 7.5 h, respectively.
Abbreviations: 3MPA-QD, 3-mercaptopropionic acid-coated CdSe-CdS/ZnS core-multishell quantum dot; HUVEC, human umbilical vein endothelial cell.
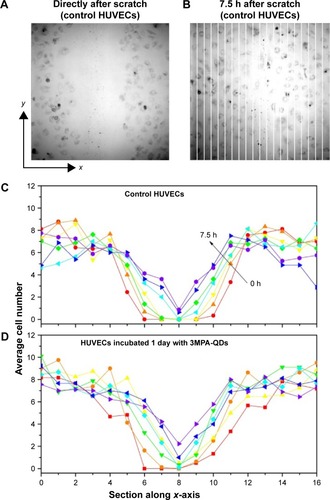
Figure 6 Cytoplasmic Ca2+ concentration modulations in control and 3MPA-QD-treated HUVECs by ATP stimulation.
Notes: (A) Representative OGB-1 fluorescence signals in several individual HUVEC cells (different colored curves) responding to ATP stimulation. (B and C) HUVECs were first co-incubated with QDs and OBG-1 for an hour, and then, the medium was replaced. QD fluorescence signals (pseudocolor red) and OGB-1 signals (pseudocolor green) detected under ATP stimulation. Red-dashed vertical lines mark the time of ATP stimulations. Image sizes =424×424.27 µm2.
Abbreviations: HUVEC, human umbilical vein endothelial cell; ATP, adenosine 5′-triphosphate; QD, quantum dot.
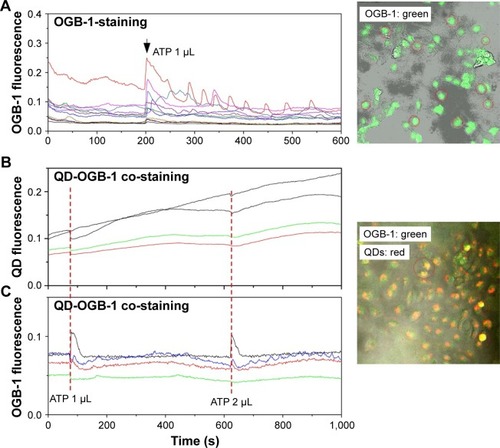
Figure 7 Modulation of QD fluorescence upon ATP stimulation in HUVECs exposed to QDs for 1 h, and then, the medium was changed.
Notes: Observations were made at 1 h and 24 h. (A) Total QD fluorescence intensity under administration of ATP and water in HUVECs at 1 and 24 h. Notice the opposite fluorescence intensity modulations of the two time points. (B) Pixel number vs fluorescence intensity in 1 h sample and (C) 24 h sample. Red = high pixel number and blue = zero pixel number.
Abbreviations: QD, quantum dot; ATP, adenosine 5′-triphosphate; HUVEC, human umbilical vein endothelial cell.
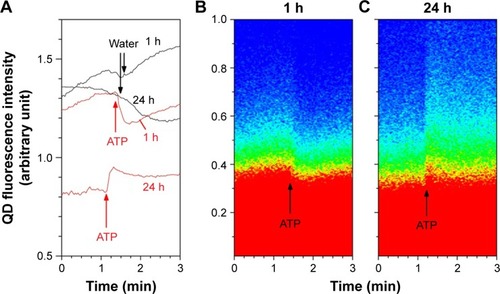
Figure 8 Colocalization of QDs and LysoTracker.
Notes: (A) HUVECs were first incubated with QDs for 1 h, washed, and then returned to the incubator for 23 h. They were labeled with LysoTracker before confocal z-stack imaging. Image sizes are 135×135 µm2. (B) QDs and LysoTracker were resolved by confocal lambda mode. In all, 405 nm laser excited both QDs and LysoTracker efficiently, while 633 nm laser excited only LysoTracker. (E) Overlapping between LysoTracker-stained compartments (C) and QDs (D) was confirmed by their pixel-by-pixel x correlation (F). (G) HUVECs were incubated with QDs for 5 h and then LysoTracker was added for 1 h. Snapshots of a time series displayed the synchronous motions of QD aggregates and LysoTracker-stained compartments (QD was pseudocolored green, LysoTracker was pseudocolored red and overlapping signal of QDs and LysoTracker was yellow). Two vertical arrow heads marked newly formed QD aggregates (green). Photobleaching of LysoTracker was obvious after ~40 s continuous laser irradiation. Image sizes are 50×50 µm2.
Abbreviations: QD, quantum dot; HUVEC, human umbilical vein endothelial cell; Ex, excitation wavelength.
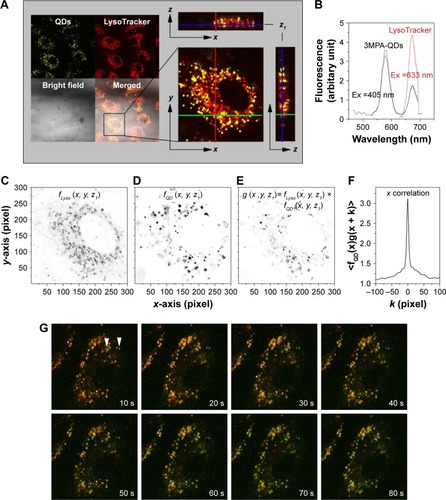
Figure 9 Osmotic permeabilization of endosomes confirmed endosomal internalization of 3MPA-QDs.
Notes: Confocal fluorescent image of QD-treated HUVECs under the deposition of 200 µM GPN. Vertical arrows mark GPN deposition. (A) QD fluorescence signal in HUVECs treated with 200 µM GPN. QD fluorescence increased in all cells (only three shown). (B) Simultaneous measurement of QD (black curves) and OGB-1 (green curves) fluorescence in HUVECs stimulated with 200 µM GPN. QD and OGB-1 superimposed signal confirms that changes in the QD fluorescence were synchronized with the release of Ca2+ from endosomes/lysosomes that corresponded with an increase in [Ca2+]i. (C) Parallel measurement of LysoTracker (red curves) and QD fluorescence signal (black curves) in HUVECs after the addition of 200 µM GPN. Permeabilization of endosomes/lysosomes by GPN was confirmed by LysoTracker fluorescence modulation. Image sizes =135×135 µm2.
Abbreviations: 3MPA-QD, 3-mercaptopropionic acid-coated CdSe-CdS/ZnS core-multishell quantum dot; [Ca2+]i, intracellular Ca{2+} concentration; QD, quantum dot; HUVEC, human umbilical vein endothelial cell; GPN, Gly-Phe-β-naphthylamide.
![Figure 9 Osmotic permeabilization of endosomes confirmed endosomal internalization of 3MPA-QDs.Notes: Confocal fluorescent image of QD-treated HUVECs under the deposition of 200 µM GPN. Vertical arrows mark GPN deposition. (A) QD fluorescence signal in HUVECs treated with 200 µM GPN. QD fluorescence increased in all cells (only three shown). (B) Simultaneous measurement of QD (black curves) and OGB-1 (green curves) fluorescence in HUVECs stimulated with 200 µM GPN. QD and OGB-1 superimposed signal confirms that changes in the QD fluorescence were synchronized with the release of Ca2+ from endosomes/lysosomes that corresponded with an increase in [Ca2+]i. (C) Parallel measurement of LysoTracker (red curves) and QD fluorescence signal (black curves) in HUVECs after the addition of 200 µM GPN. Permeabilization of endosomes/lysosomes by GPN was confirmed by LysoTracker fluorescence modulation. Image sizes =135×135 µm2.Abbreviations: 3MPA-QD, 3-mercaptopropionic acid-coated CdSe-CdS/ZnS core-multishell quantum dot; [Ca2+]i, intracellular Ca{2+} concentration; QD, quantum dot; HUVEC, human umbilical vein endothelial cell; GPN, Gly-Phe-β-naphthylamide.](/cms/asset/7653a2d4-dcea-4201-8291-16132903b0cb/dijn_a_12193801_f0009_c.jpg)
Figure 10 QDs were internalized in early endosomes.
Notes: (A and B) In the QD/LysoTracker co-stained sample, QDs (green) and LysoTracker (red) were co-localized after 40 min. (C and D) LysoTracker was first added to the cells and then washed away to stain only the preexisting endosomes/lysosomes. QDs were deposited afterward. White arrows mark stationary QD aggregates at the cell edge; blue arrows mark the QD aggregates at two different time points. In A and B, QDs aggregated at 19 min and LysoTracker staining was detected at 40 min, while in C and D, the QD aggregates formed at 19 min were not merged with preexisting LysoTracker-stained endosomes/lysosomes. Red arrows mark the z-positions of the QD aggregates. Image sizes =135×135×15 µm3.
Abbreviation: QD, quantum dot.
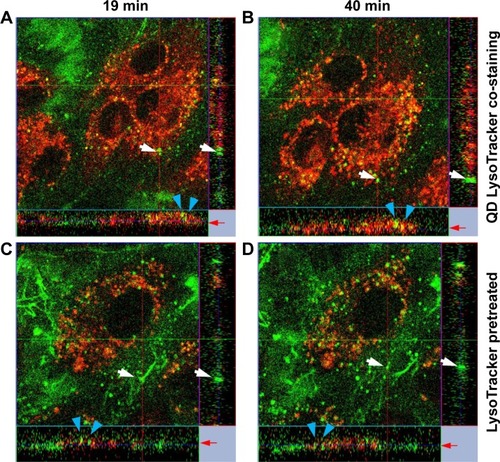
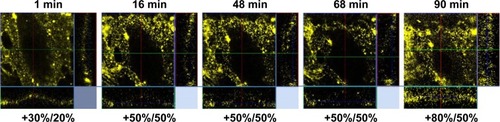
Figure 11 Temporal distribution of QDs applied on HUVECs at 4°C.
Notes: The numbers below the confocal images refer to brightness and contrast values used to visualize the QD fluorescence signals. The cell contour (clearer in side panels) was clear, and QDs gradually dispersed. Image sizes =54×54×16 µm3.
Abbreviations: QD, quantum dot; HUVEC, human umbilical vein endothelial cell.