Figures & data
Figure 1 Morphology characterization of CA/BaSO4 microcapsules. Optical images of (A) BA beads and (B) CA/BaSO4 microcapsules in pure water at room temperature. Micrographs of CA/BaSO4-loading Bifidobacterium under (C) bright field and (D) fluorescence field. Bifidobacterium were stained by Hoechst (D). SEM images of surface (E) and inside (F) CA/BaSO4 microcapsules. Bifidobacterium are marked by red circle.
Abbreviations: CA/BaSO4, chitosan-coated alginate microcapsule loaded with in situ synthesized barium sulfate; BA, barium-mediated alginate; SEM, scanning electron microscopy.
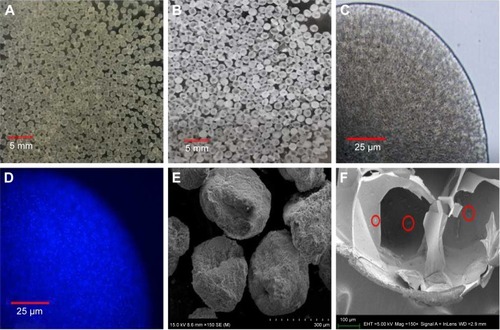
Figure 2 (A) XRD patterns of CA/BaSO4 microcapsules measured with 2θ ranging from 5° to 90.0° in a step of 0.02° under a Cu Ka radiation. (B) CT images of CA/BaSO4 microcapsules using various concentrations of Na2SO4 as injection liquid arranged from 0 mg/mL to 7.5 mg/mL (b–e: 0, 2.5, 5, 7.5 mg/mL); phospate buffered saline was used as the negative control (a) and iodixanol solution was used as the positive control (f). (C) SEM images of barium sulfate nanoclusters.
Abbreviations: XRD, x-ray diffraction; CA/BaSO4, chitosan-coated alginate microcapsule loaded with in situ synthesized barium sulfate; CT, computed tomography; SEM, scanning electron microscopy.
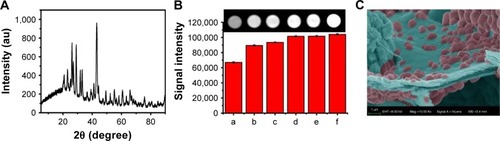
Figure 3 (A) Viable count and (B) survival of free Bifidobacterium, Bifidobacterium in BA beads and Bifidobacterium in CA/BaSO4 microcapsules after being immersed in pH 2.5 gastric acid. *P<0.05, **P<0.01.
Abbreviations: BA, barium-mediated alginate; CA/BaSO4, chitosan-coated alginate microcapsule loaded with in situ synthesized barium sulfate.
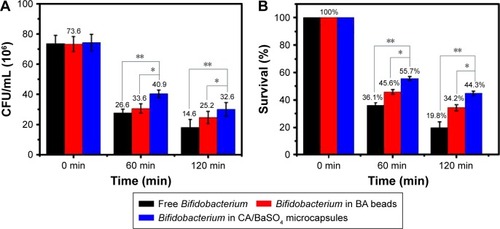
Figure 4 Release rate of Bifidobacterium from BA beads and CA/BaSO4 microcapsules after being immersed in simulated solution pH ranging from 2 to 10.
Abbreviations: BA, barium-mediated alginate; CA/BaSO4, chitosan-coated alginate microcapsule loaded with in situ synthesized barium sulfate.
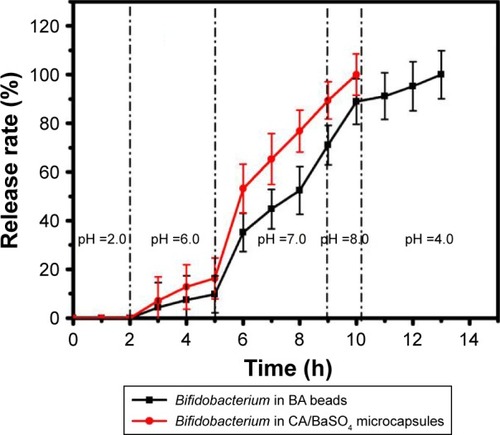
Figure 5 CA/BaSO4 microcapsule-mediated Bifidobacterium delivery for DSS-induced colitis treatment in mice. (A) Loss of basal body weight under different treatments during the disease process. a, normal; b, DSS; c, CA/BaSO4 microcapsule-encapsulated 0.6×10⁹ CFU Bifidobacterium; d, CA/BaSO4 microcapsule-encapsulated 1.2×10⁹ CFU Bifidobacterium, e. CA/BaSO4 microcapsule-encapsulated 2.4×10⁹ CFU Bifidobacterium; f, free 2.4×10⁹ CFU Bifidobacterium; g, sulfasalazine; h, free CA/BaSO4 microcapsules. (B) DAI under different treatments. (C) The macroscopic appearances and length of colons (D) from each group of mice under different treatments (n=6 per group). Data are presented as mean ± standard error of the mean. *P<0.05, **P<0.01 vs DSS-treated alone group at the same day.
Abbreviations: CA/BaSO4, chitosan-coated alginate microcapsule loaded with in situ synthesized barium sulfate; DSS, dextran sulfate sodium; DAI, disease activity index.
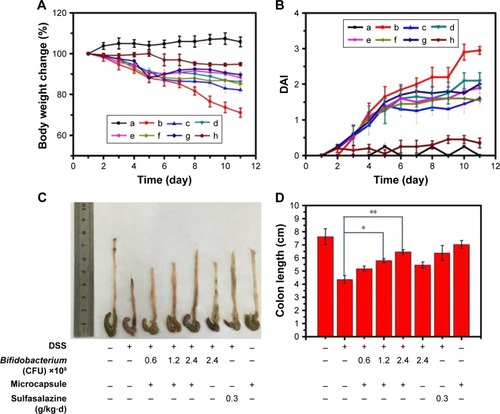
Figure 6 Pathological analysis of colon tissues after distinct treatments using H&E staining assay, magnification =100×. (A) Normal control, (B) CA/BaSO4 microcapsule treatment, (C) DSS induction, (D) sulfasalazine treatment after DSS induction, (E) 0.6×10⁹ Bifidobacterium-loading CA/BaSO4 microcapsule treatment after DSS induction, (F) 1.2×10⁹ Bifidobacterium by microcapsule treatment after DSS induction, (G) 2.4×10⁹ Bifidobacterium by microcapsule treatment after DSS induction, (H) 2.4×10⁹ Bifidobacterium treatment after DSS induction. The blue circles denote infiltration of mononuclear, submucosal lymphoid hyperplasia, and extension around intestinal glands; yellow arrows denote the distortion of crypts and loss of goblet cells; the green arrows denote the severe mucosal damage in the colon.
Abbreviations: CA/BaSO4, chitosan-coated alginate microcapsule loaded with in situ synthesized barium sulfate; DSS, dextran sulfate sodium.
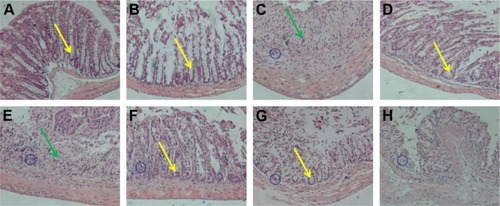
Figure 7 CT scan images of mice at designated time intervals after oral CA/BaSO4 microcapsules. Red, yellow and blue arrows, respectively, denote stomach, small intestine and large intestine.
Abbreviations: CT, computed tomography; CA/BaSO4, chitosan-coated alginate microcapsule loaded with in situ synthesized barium sulfate.
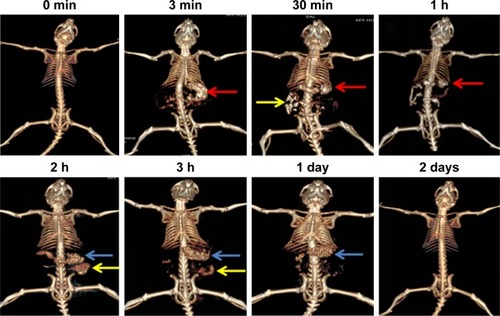
Figure 8 Rarefaction analysis of different samples. Rarefaction curves of OTUs clustered at 3% phylotype similarity level.
Abbreviation: OTU, operational taxonomic unit.
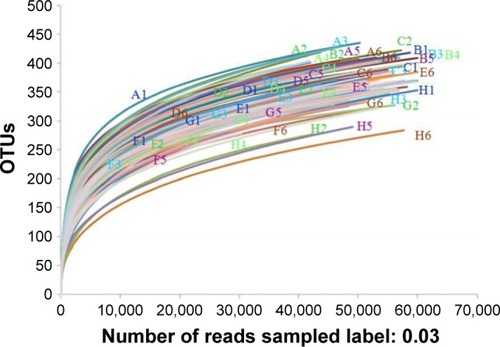
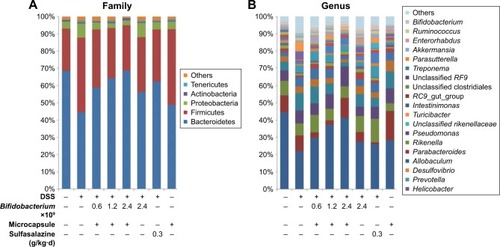
Figure 9 (A) Overall fecal microbiota compositions of each sample with a family level and (B) overall fecal microbiota compositions of each sample with genus level.
Abbreviation: DSS, dextran sulfate sodium.
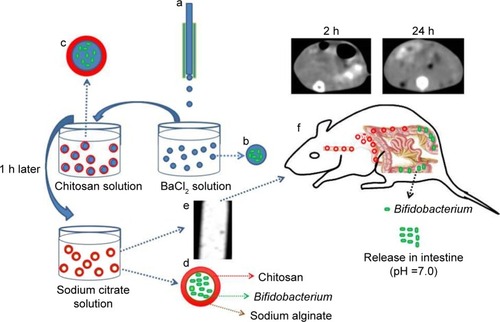
Scheme 1 Illustration of the preparation process of the CA/BaSO4 microcapsules for pH-responsive protection and release of Bifidobacterium. (a) A droplet microfluidic device, (b) formation of BA beads, (c) chitosan-coated BA beads, (d) sodium citrate liquidation, (e) CT image of CA/BaSO4 microcapsules, (f) real-time imaging of CA/BaSO4 microcapsules and releasing Bifidobacterium in vivo.
Abbreviations: CA/BaSO4, chitosan-coated alginate microcapsule loaded with in situ synthesized barium sulfate; CT, computed tomography.