Figures & data
Figure 1 Chemical structure of chlorambucil.
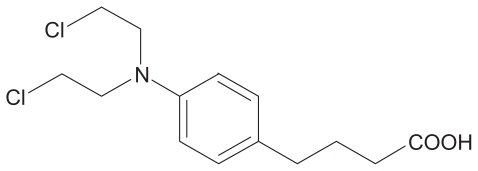
Table 1 Formulation components of the lipophilic mixture of the final lipid nanospheres
Table 2 Formulation components of the surfactant mixture of the final lipid nanospheres
Table 5 Drug loading amount and entrapment efficiency (EE%) of the optimized lipid nanospheres (formulation composed of lipophilic mixture 2: MCT: 10 mg·mL−1, LCT: 10 mg·mL−1, monostearin 40: mg·mL−1, and surfactant mixture 1: E80: 20 mg·mL−1, Tween 80: 30 mg·mL−1, Lutrol F 68:10 mg·mL−1)
Table 3 Effect of different lipophilic mixtures on lipid nanospheres droplet size and entrapment efficiency (EE%); aqueous phase composed of surfactants 1 (E80: 20 mg·mL−1, Tween 80: 30 mg·mL−1, Lutrol F 68: 10 mg·mL−1), and 0.7 mg drugs added per mL of lipid nanospheres
Table 4 Effect of composition of surfactants on lipid nanospheres droplet size and entrapment efficiency (EE%); lipid mixtures composed of lipophilic mixture 2 (MCT: 10 mg·mL−1, LCT: 10 mg·mL−1, monostearin 40: mg·mL−1), 0.7 mg drugs added for per mL of lipid nanospheres
Figure 2 Mean particle size diameters of formulations after reconstitution with an optimized combination of cryoprotectants.
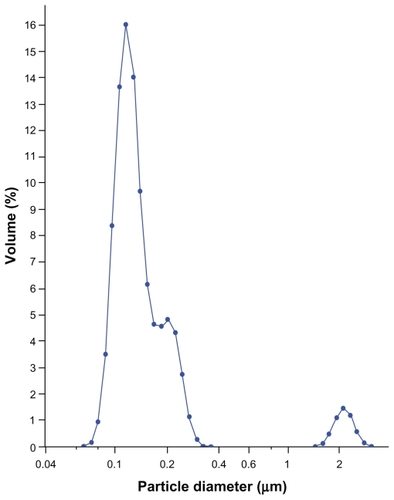
Table 6 Effects of cryoprotectants on morphological characteristics of reconstituted lipid nanospheres from freeze-dried suspension (cryoprotectant concentration %)
Figure 3 A transmission electron microscopy image of 2% phosphotungstic acid-stained lipid nanospheres (pH adjusted to 7.4 with 0.1 mol/L−1 NaOH after preparation) (×40,000, bar = 200 nm).
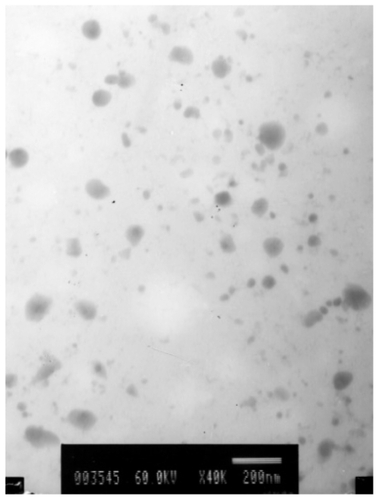
Figure 4 Differential scanning calorimetry scan of lyophilized lipid nanospheres (LNS) powder heating from 30°C to 120°C at a rate of 10°C·min−1. 1) The physical mixture material; 2) Placebo LNS; 3) Drug-loaded LNS (containing 0.7 mg·mL−1 of the model drug).
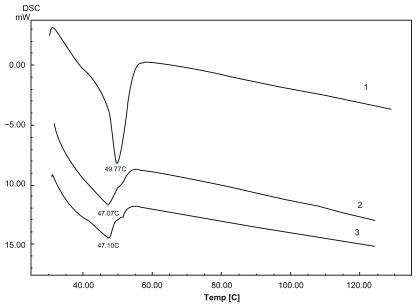
Figure 5 Mean plasma log concentration–time profiles after iv administration of lipid nanospheres of chlorambucil (CHL-LNS) and free chlorambucil (CHL) at a dose of 10 mg·kg−1 in mice.
Note: Results are shown as mean ± SD.
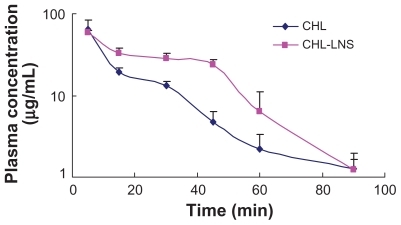
Table 7 Pharmacokinetic parameters after iv administration of chlorambucil (CHL) injection and lipid nanospheres (CHL-LNS) to mice
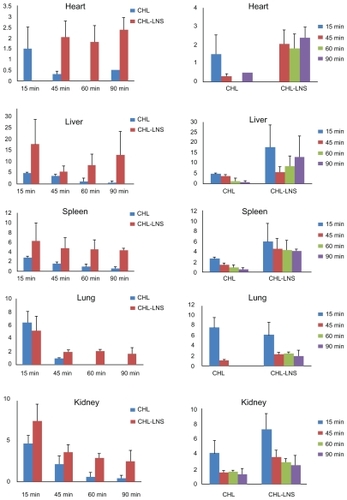
Figure 6 Distribution profiles in various organs after iv administration of lipid nanospheres of chlorambucil (CHL-LNS) and free chlorambucil (CHL) at a dose of 10 mg·kg−1 in mice.
Note: Bars represent standard error of 3 determinations.