Figures & data
Table 1 The displayed peptide sequences of screening phage from in vivo lung cancer xenografts
Figure 1 Synthetic scheme of polyamidoamine dendrimer generation 4 fluorescence-labeled acetylated polyamidoamine lung cancer targeting peptide.
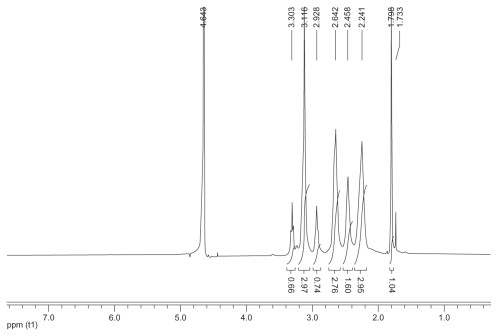
Figure 2 Ultraviolet-visible spectra of the synthesized polyamidoamine conjugates. The peak at 500 nm indicates the presence of fluorescence-labeling in the conjugates. The peptide adsorbance peak at 275 nm was overlapped with the broad adsorbance peak of fluorescence-labeling at 275 nm.
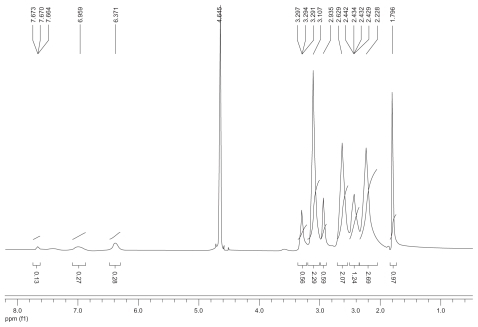
Figure 3 MTT assay for cellular toxicity of 293T cells. Cells were incubated with polyamidoamine, fluorescence-labeled acetylated polyamidoamine, acetylated polyamidoamine and fluorescence-labeled acetylated polyamidoamine lung cancer targeting peptide, at varied concentrations. The viability of the nontreated cells was arbitrarily defined as 100%. Data are expressed as mean ± standard deviation (n = 6).
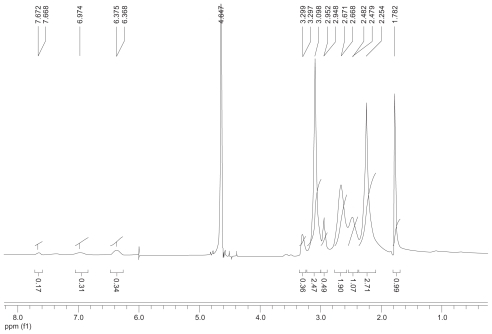
Figure 4 In vitro evaluation of dose-dependent uptake of the conjugates (fluorescence-labeled acetylated polyamidoamine and fluorescence-labeled acetylated polyamidoamine lung cancer targeting peptide) by 293T cells (A) and NCI-H460 cells (B) determined by fluorescence-activated cell sorting. The cells were incubated with various concentrations of the conjugates for 4 hours at 37°C. C) Time-dependent uptake of the conjugates by NCI-H460 cells. The NCI-H460 cells were incubated with the conjugates at a concentration of 0.25 μM for different time. D) Uptake of the conjugates by 293T and NCI-H460 cells. The incubation conditions were 0.5 μM and four hours.
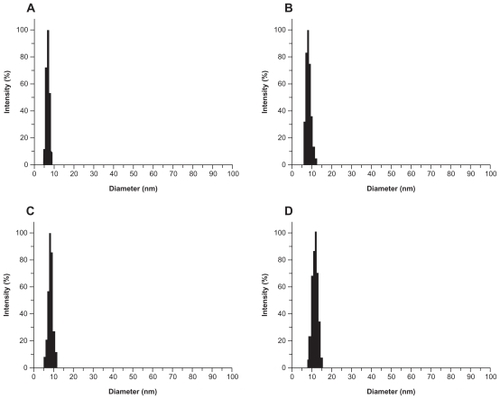
Figure 5 In vitro evaluation of the conjugates (fluorescence-labeled acetylated polyamidoamine and fluorescence-labeled acetylated polyamidoamine lung cancer targeting peptide) targeting to 293T and NCI-H460 cells determined by inverted fluorescence microscopy. The cells were incubated with the conjugates (0.5 μM) for 4 hours. 100 × (A) 293T cells incubated with fluorescence-labeled acetylated polyamidoamine. B) 293T cells incubated with fluorescence-labeled acetylated polyamidoamine lung cancer targeting peptide. C) NCI-H460 cells incubated with fluorescence-labeled acetylated polyamidoamine. D) NCI-H460 cells incubated with fluorescence-labeled acetylated polyamidoamine lung cancer targeting peptide. E) local amplification of D.
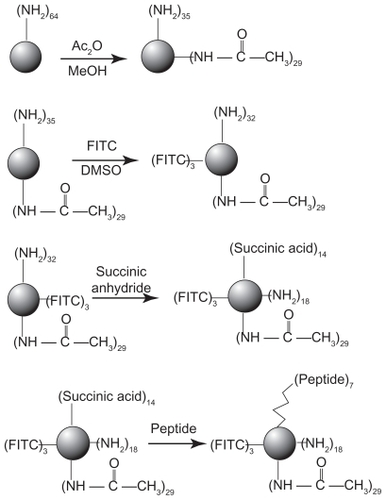
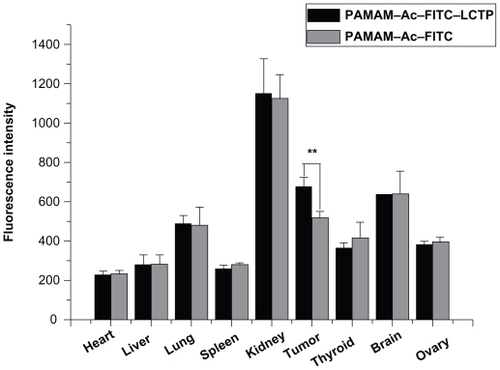
Figure 6 Distribution of fluorescence-labeled acetylated polyamidoamine and fluorescence-labeled acetylated polyamidoamine lung cancer targeting peptide 4 hours postinjection in athymic mice bearing nonsmall cell lung cancer tumor xenografts, the relative fluorescence intensity per unit area data are presented as mean ± standard deviation (n = 6, **P < 0.01 fluorescence-labeled acetylated polyamidoamine lung cancer targeting peptide versus fluorescence-labeled acetylated polyamidoamine in tumor).
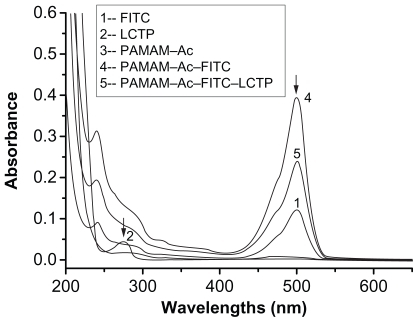
Figure S1 1H nuclear magnetic resonance spectrum (300 mHz,D2O) of the acetylated polyamidoamine.
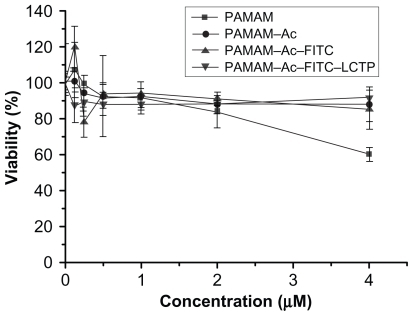
Figure S2 1H nuclear magnetic resonance spectrum (300 mHz,D2O) of the fluorescence-labeled acetylated polyamidoamine.
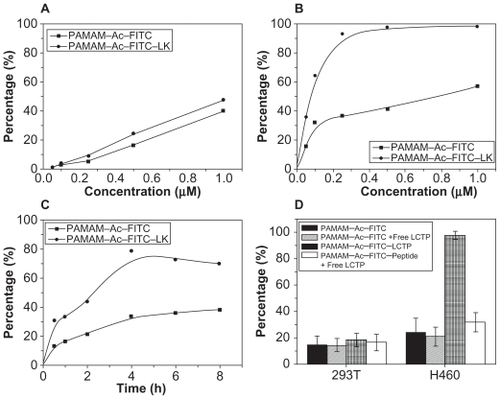
Figure S3 1H nuclear magnetic resonance spectrum (300 mHz, D2O) of the fluorescence-labeled acetylated polyamidoamine lung cancer targeting peptide.
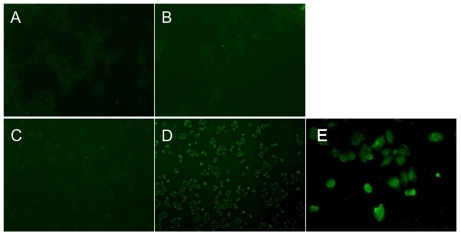
Figure S4 Laser light-scattering assay results. The polyamidoamine particle size was about 7 nm (A) and the particle size of acetylated polyamidoamine (B) fluorescence-labeled acetylated polyamidoamine (C), and fluorescence-labeled acetylated polyamidoamine lung cancer targeting peptide (D) becomes bigger and bigger.