Figures & data
Figure 1 Characterization of GA-Fe@BSA NPs.
Notes: (A) 3-D AFM topography and height profile (measurements along a line are given after AFM imaging); (B) hydrodynamic size; (C) powder prepared in one synthesis reaction; (D) aqueous solution of GA-Fe@BSA NPs.
Abbreviations: GA, gallic acid; NPs, nanoparticles; AFM, atomic force microscopy.
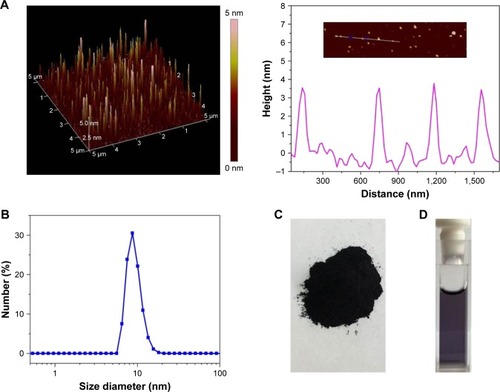
Figure 2 FT-IR (A) and UV-visible NIR absorption spectra (B) of GA-Fe@BSA NPs.
Abbreviations: FT-IR, Fourier-transform infrared; UV, ultraviolet; NIR, near-IR; GA, gallic acid; NPs, nanoparticles.
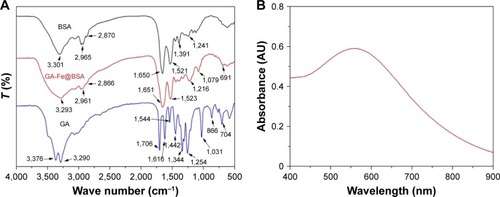
Figure 3 Photothermal performance of the GA-Fe@BSA NPs.
Notes: (A) NIR thermal images and (B) temperature variations of GA-Fe@BSA NPs at increasing concentrations, after laser ablation in the same conditions. (C) Photostability tests for water dispersion of GA-Fe@BSA NPs after eight laser on/off cycles.
Abbreviations: NIR, near-infrared; GA, gallic acid; NPs, nanoparticles.
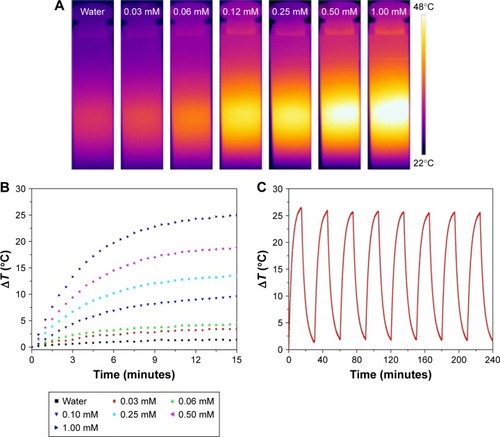
Figure 4 (A) Relaxivity (r1 and r2) and (B) T1-weighted MRI images of GA-Fe@BSA NPs versus Fe3+ concentrations in solution.
Abbreviations: MRI, magnetic resonance imaging; GA, gallic acid; NPs, nanoparticles.
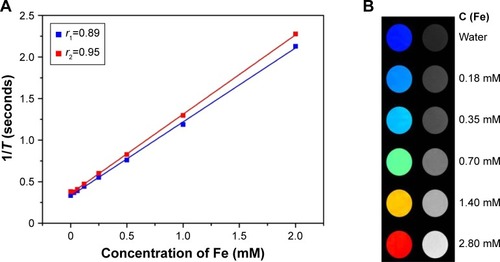
Figure 5 The biocompatibility of GA-Fe@BSA NPs.
Notes: (A) Cell viability of human macrophages after incubation with GA-Fe@BSA NPs at different concentrations (0, 10, 25, 50, 100, and 200 mM) for 12 and 24 hours. (B) Rates of hemolysis in RBCs after 1-hour incubations with increasing GA-Fe@BSA NP concentrations. (C) Visual differences observed in RBCs treated with water, PBS, and concentrations of GA-Fe@BSA NPs after centrifugation. (D) Cell-cycle analyses of HEK293T cells treated with 200 μM GA-Fe@BSA NPs for 24 hours. (E) Routine blood analyses for subjects after intravenous infusion of GA-Fe@BSA NPs (200 μL, 20 mM for each mouse) for 3 days: urea nitrogen levels, albumin:globulin ratios, white blood-cell counts, hemoglobin levels, mean corpuscular volumes, and mean corpuscular hemoglobin levels.
Abbreviations: GA, gallic acid; NPs, nanoparticles; RBCs, red blood cells.
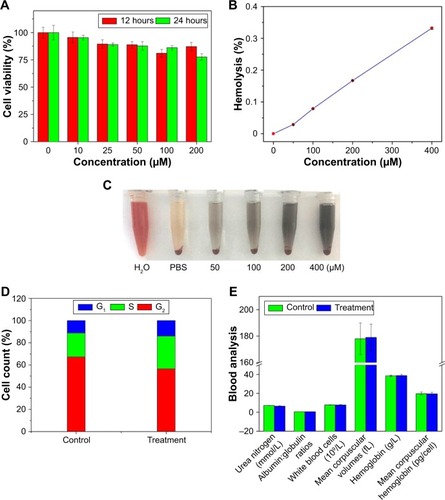
Figure 6 MRI findings.
Notes: In vivo images of (A) livers (marked with ellipses), (B) kidneys (marked with rectangles), and (C) bladders (marked with circles) of subjects before (0 h) and after (0.16, 2, 6, and 24 h) intravenous infusion with GA-Fe@BSA NPs. (D) Corresponding MR-signal intensities of MRI shown in (A–C).
Abbreviations: MRI, magnetic resonance imaging; GA, gallic acid; NPs, nanoparticles.
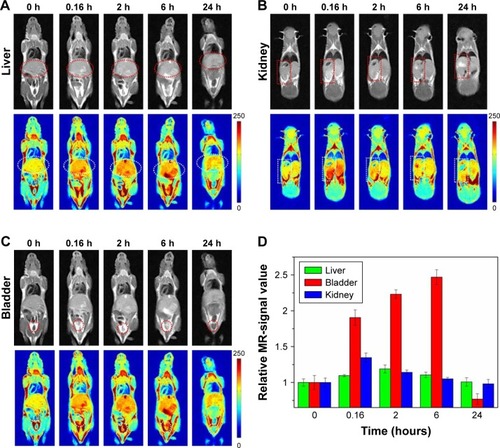
Figure 7 (A) MRI and (B) corresponding relative signal values of tumor-bearing subjects before and after intratumoral injection of GA-Fe@BSA NPs.
Abbreviations: MRI, magnetic resonance imaging; GA, gallic acid; NPs, nanoparticles.
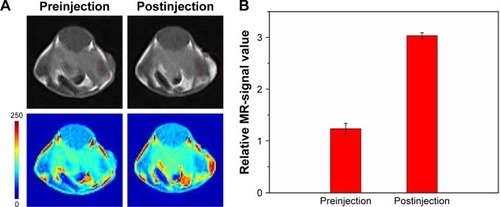
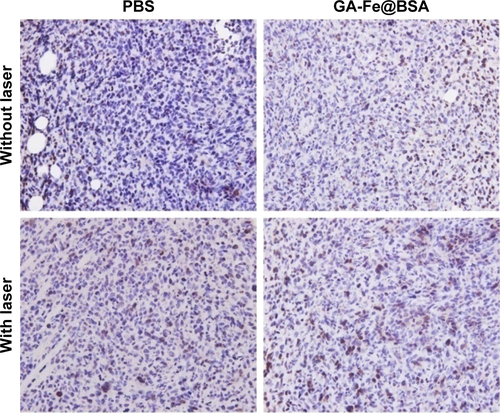
Figure 8 In vivo photothermal therapy.
Notes: NIR thermal images (A) and corresponding temperature variations (B) of mice bearing tumors after intratumoral injection with PBS or GA-Fe@BSA and receiving laser ablation; (C) representative images of tumor sections taken from each exposure group (magnification 40×).
Abbreviations: NIR, near-infrared; GA, gallic acid.
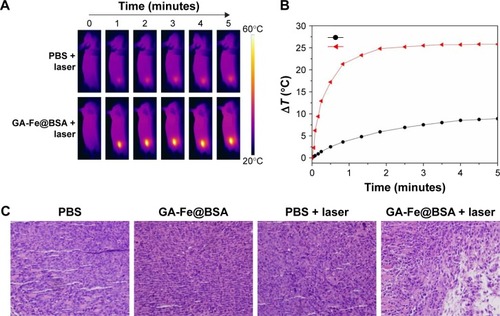
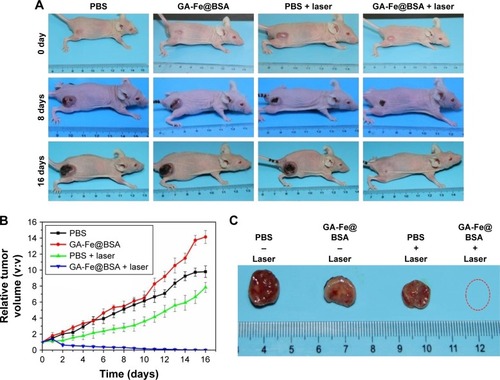
Figure 9 Tumor changes after photothermal therapy.
Notes: (A) Representative images and (B) profiles of tumor volumes in mice, with different treatments at different time points; (C) representative images of dissected tumors from mice 16 days after different treatments without (-) or with laser ablation (+). The red circle denotes that no tumor was dissected.
Abbreviation: GA, gallic acid.
Scheme 1 Synthesis protocol for GA-Fe@BSA NPs and application of GA-Fe@BSA NPs in in vivo MRI and PTT for cancer.
Abbreviations: GA, gallic acid; NPs, nanoparticles; MRI, magnetic resonance imaging; PTT, photothermal therapy.
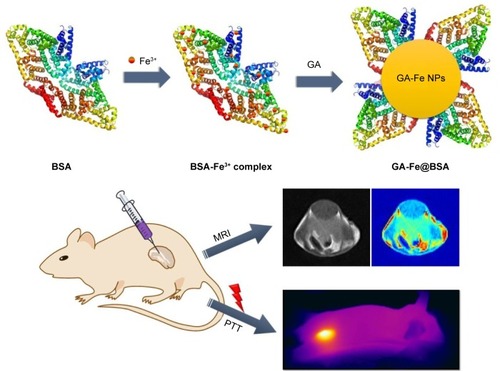
Figure S1 Color changes at different stages in synthesis of GA-Fe@BSA nanoparticles.
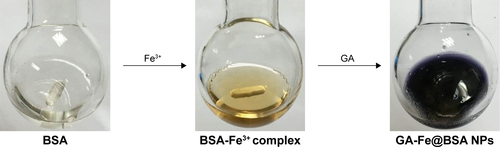
Figure S2 FT-IR of the BSA (red color) and BSA-Fe complex (blue color).
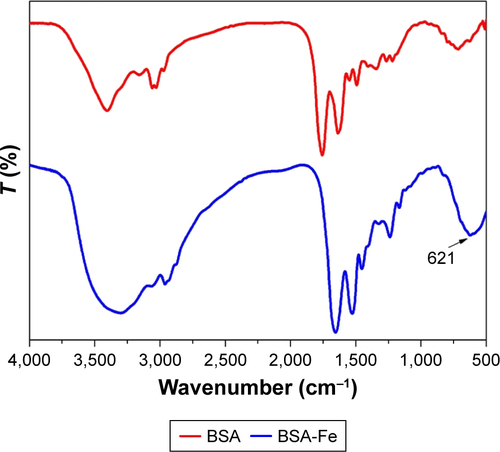
Figure S3 UV-vis-NIR absorption spectra of the BSA, BSA-Fe3+ complex, GA, GA-Fe and GA-Fe@BSA nanoparticles.
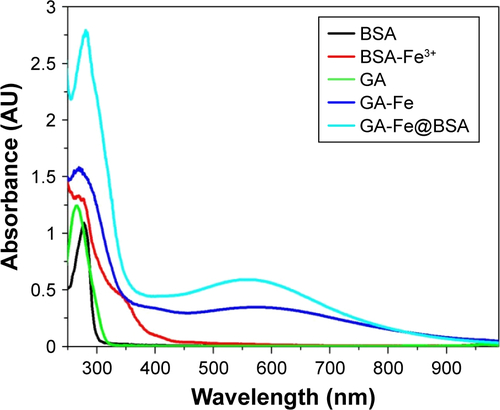
Figure S4 The fluorescence spectra of pure BSA, BSA after adding Fe3+ and GA-Fe@BSA nanoparticles.
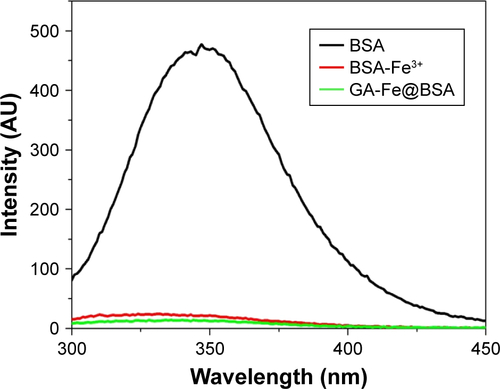
Figure S5 Circular dichroism spectra (recorded by BioLogic ALX250) of pure BSA, BSA-Fe3+ and GA-Fe@BSA nanoparticles.
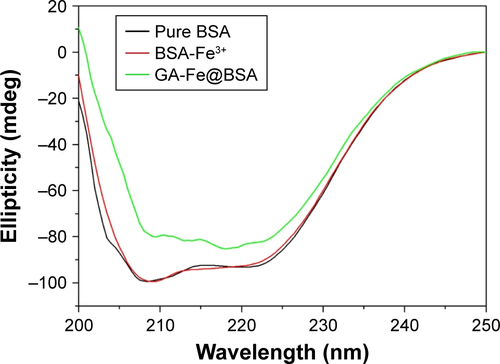
Figure S6 The primary data of dynamic light scattering analysis generated by the Malvern Zetasizer Nano ZS.
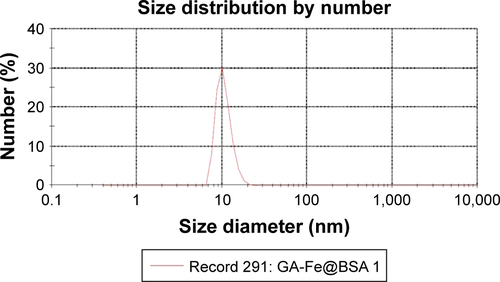
Figure S7 TEM images of the obtained with different magnification: (A) low magnification, (B) high magnification.
Abbreviation: TEM, transmission electron microscopy.
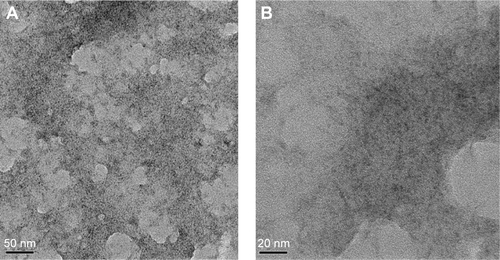
Figure S8 (A) UV-vis-NIR absorption spectra of the as prepared GA-Fe@BSA nanoparticles with different concentrations dispersed in water before and after the laser irradiation. (B) The absorption of the GA-Fe@BSA nanoparticles with different concentrations dispersed in water at 808 nm before and after the laser irradiation.
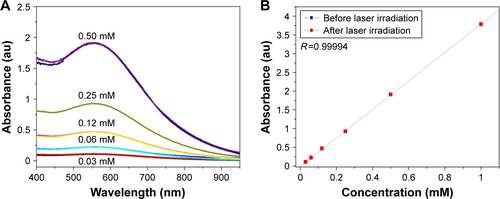
Figure S9 Frequency of micronucleated RAW cells incubated with GA-Fe@BSA. The values represent the mean of three experiments ± SD. Each frequency is not significantly different (p>0.05) from that of control cell in a Student’s t-test (using the methods of AshaRani et alCitation1).
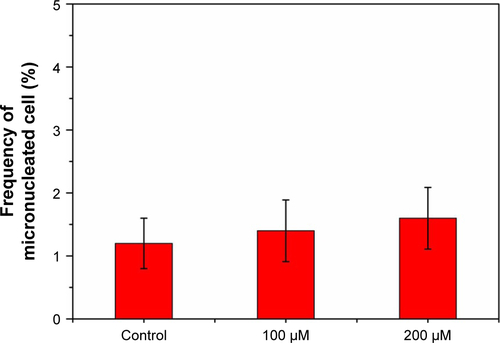
Figure S10 The Iron concentration in the urine (A) and blood (B) of the mice administrated with PBS (control) and GA-Fe@BSA nanoparticles (treatment) at 0 and 24 h.
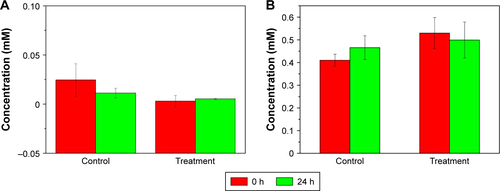
Figure S11 Typical images tumor section with TUNEL staining for the group of PBS, PBS + laser, GA-Fe@BSA and GA-Fe@BSA + laser, respectively.