Figures & data
Figure 1 TM-AFM analysis (images acquired within 10–15 minutes from deposition on mica support).
Abbreviations: TM-AFM, tapping mode atomic force microscopy.
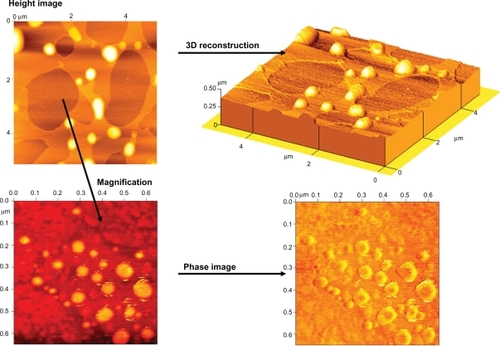
Figure 2 ESEM micrographs of liposomes: a) 4.0°C, 6.45 Torr; b) 9.0°C, 4.32 Torr; c) 9.0°C, 2.65 Torr.
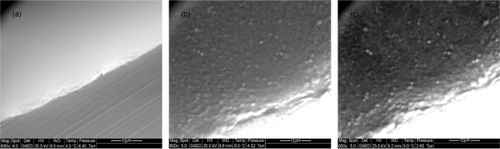
Figure 3 NS-TEM images of liposomes.
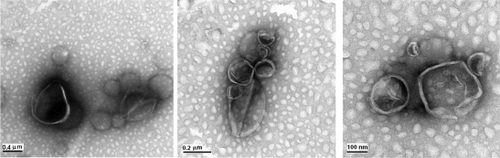
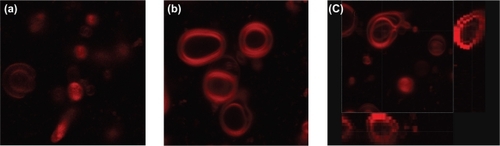
Figure 4 Confocal images illustrating the architecture of liposomes (a and b). Rhodamine 123 was localized into the bilayer structures. c) Three-dimensional projection of liposomes identifying lamellae of multilamellar liposomes.