Figures & data
Table 1 Formulation formula and percent yield value and entrapment efficiency value of all formulation batches
Table 2 Mathematical models used to describe dissolution curves
Table 3 Percent swelling, mean particle size, zeta potential, and percent adhesive strength values of microspheres of all formulation batches
Figure 1 Scanning electron microscopy of microspheres of formulation batch F1.
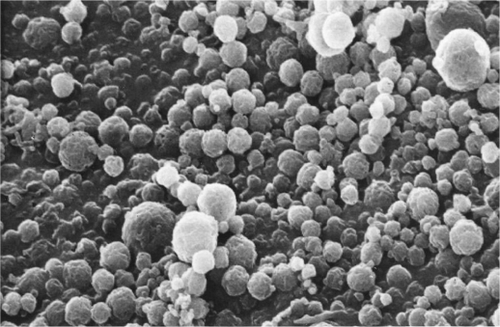
Figure 2 Histogram of mean particle size distribution of all formulation batches.
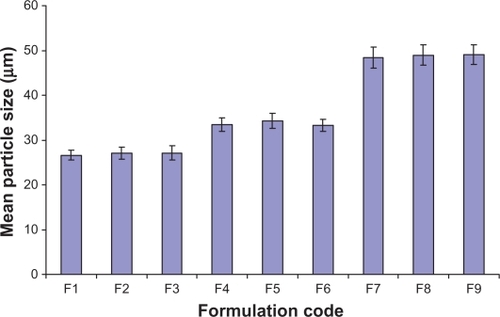
Figure 3 Zeta potential report of uncoated microspheres from formulation batch F1.
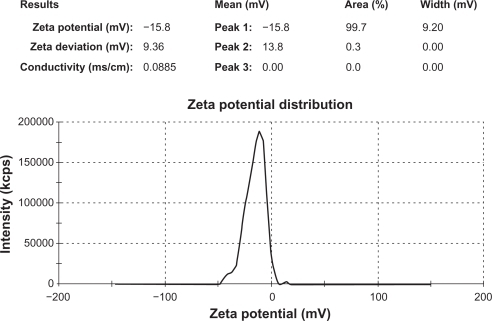
Table 4 Results of in vitro wash-off test of all formulation batches
Figure 4 Comparative dissolution profile (model dependent, Zero-order kinetic model) of all formulation batches.
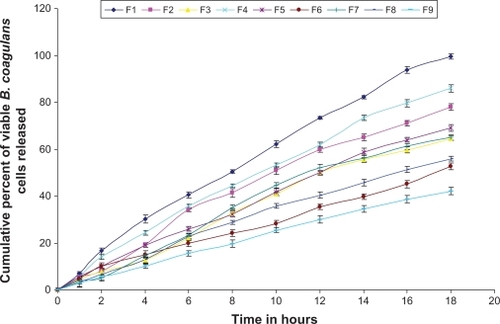
Table 5 Mean value of dissimilarity factor (f1), similarity factor (f2), and two indices of rescigno (ξ1 and ξ2)
Table 6 Linearization of B. coagulans dissolution profile using model-dependent approach, ie, the Zero-order and the Weibull