Figures & data
Figure 1 Schematic diagram of the synthesis of polymersomes, cell labeling, cell transplantation, MRI tracking, and long-term fate of grafted GFP-MSCs.
Abbreviations: IL, interleukin; MSC, mesenchymal stem cell; MRI, magnetic resonance imaging; PEI, poly(-etherimide); PDLLA, poly(d,l-lactide); SPIO, superparamagnetic iron oxide.

Figure 2 Efficacy of cell labeling.
Notes: In vitro MRI shows that GFP-MSCs labeled with SPION-loaded polymersomes have an obvious hypointense signal on T1WI, T2WI, and T2*WI, and decreased T2 value compared with unlabeled GFP-MSCs (A). Prussian blue staining shows abundant blue-stained particles inside GFP-MSCs labeled with SPION-loaded polymersomes (B), but no blue-stained particles in unlabeled GFP-MSCs (C) (Bar =100 µm). TEM shows numerous, dense, iron particles in the cytosol (arrows) of GFP-MSCs labeled with SPION-loaded polymersomes (D), whereas no such iron particles are found in unlabeled GFP-MSCs (E) (Bar =200 nm).
Abbreviations: MSC, mesenchymal stem cell; MRI, magnetic resonance imaging; SPION, superparamagnetic iron oxide nanoparticle.
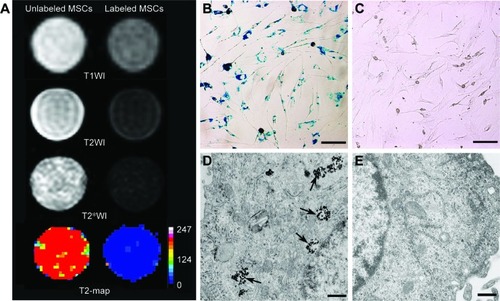
Figure 3 In vitro cytotoxicity of cell labeling.
Notes: Graphs show no significant differences in the cell viability (A, n=6), apoptosis rate (B, n=3) and intracellular ROS level (C, n=6) at 24 h after GFP-MSCs labeling with SPION-loaded polymersomes compared with unlabeled GFP-MSCs. Confocal laser microscopy shows that a few GFP-MSCs labeled with SPION-loaded polymersomes (D) and unlabeled GFP-MSCs (E) are ROS positive (arrows). Bar =100 µm.
Abbreviations: MSC, mesenchymal stem cell; ROS, reactive oxygen species; SPION, superparamagnetic iron oxide nanoparticle.
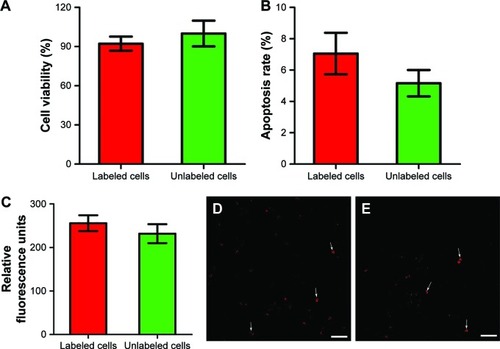
Figure 4 Therapeutic effects of transplanted MSCs.
Notes: Longitudinal coronal T2WI shows that the infarcted hemisphere in animals grafted with polymersome-labeled GFP-MSCs (A), unlabeled GFP-MSCs (B), and PBS (C) exhibited hyperintense signals. Graphs show the measured infarct volume (D) and modified neurologic severity scores (E) among the three groups. *p<0.05 between labeled GFP-MSCs and PBS; #p<0.05 between unlabeled GFP-MSCs and PBS.
Abbreviations: mNSS, modified neurological severity score; MSC, mesenchymal stem cell; PBS, phosphate-buffered saline.
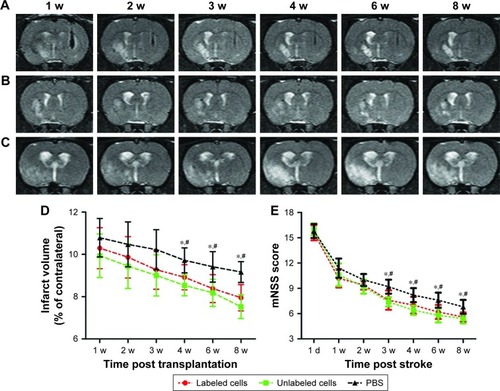
Figure 5 In vivo MRI of the grafted MSCs.
Notes: Longitudinal coronal T2*WI show a persistent hypointense area (arrows) in the striatum of animals grafted with polymersome-labeled GFP-MSCs (A). These hypointense signal areas were obviously reduced at 2 weeks, and then gradually reduced but remained until 8 weeks after transplantation. At 2 weeks after transplantation, a spotty hypointense area was found in the ipsilateral corpus callosum (arrow head). No obvious hypointense signal was observed in animals grafted with unlabeled GFP-MSCs (B) and PBS (C). Graphs show the hypointense signal volume (D) and signal–contrast ratio (E) on T2WI and T2*WI in animals grafted with polymersome-labeled GFP-MSCs. #p<0.05.
Abbreviations: MSC, mesenchymal stem cell; PBS, phosphate-buffered saline.
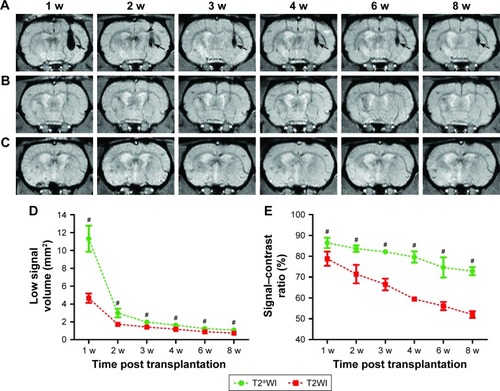
Figure 6 Apoptosis and survival of GFP-MSCs at implantation site.
Notes: TUNEL analysis shows that apoptotic cells peaked at 1 week, and then decreased over time in animals grafted with labeled GFP-MSCs (A), unlabeled GFP-MSCs (B), and PBS (C). Graph show the percentages of TUNEL-positive cells in animals grafted with labeled and unlabeled GFP-MSCs (D). Graph shows the number of apoptotic GFP-MSCs in animals grafted with labeled and unlabeled GFP-MSCs (E). Graph shows the percentage of viable GFP-positive cells in animals grafted with labeled and unlabeled GFP-MSCs (F). *p<0.05 between labeled GFP-MSCs and PBS; #p<0.05 between unlabeled GFP-MSCs and PBS; Bar =15 µm.
Abbreviations: MSC, mesenchymal stem cell; PBS, phosphate-buffered saline.
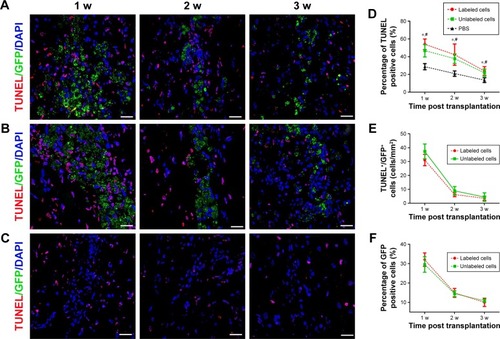
Figure 7 Relationship between SPIONs and macrophages.
Notes: Representative photomicrographs of iron and CD11b co-staining show that many iron+/CD11b+ cells (dark blue cells) are present in the injection site (A) and in the corpus callosum (B) in animals grafted with polymersome-labeled GFP-MSCs. Graphs show the percentages of iron+/CD11b+ cells in the injection site (C) and corpus callosum (D). *p<0.05. Bar =25 µm.
Abbreviations: MSC, mesenchymal stem cell; SPIONs, superparamagnetic iron oxide nanoparticles.
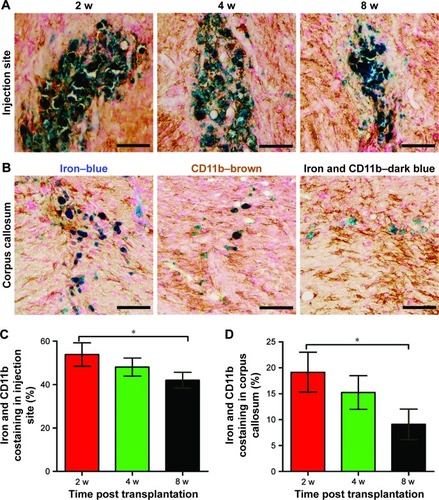
Figure 8 Histology of the grafted cells in the injection site.
Notes: Fluorescence immunostaining micrographs show that GFP-MSCs remained in the injection site in animals grafted with polymersome-labeled GFP-MSCs and unlabeled GFP-MSCs. Only a few surviving GFP-MSCs differentiated into GFAP-positive astrocytes (arrows), but not into NeuN-positive neurons. A large number of cells were phagocytized by macrophages (arrows) (A). Graphs show the numbers of GFAP+GFP+ (B), CD11b+GFP+ (C), and the percentage of GFP-MSCs (D) in animals grafted with polymersome-labeled GFP-MSCs and unlabeled GFP-MSCs. Bar =15 µm.
Abbreviation: MSC, mesenchymal stem cell.
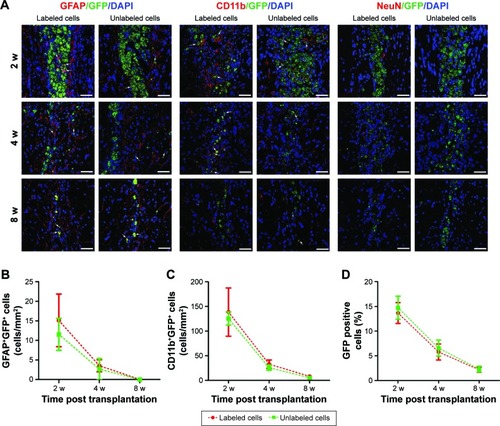
Figure 9 Histology of migrating cells in the corpus callosum.
Notes: Fluorescence immunostaining micrographs show that a small amount of GFP-MSCs migrated to the corpus callosum in animals treated with polymersome-labeled cells and unlabeled cells. Only a few surviving GFP-MSCs were differentiated into GFAP-positive astrocytes (arrows) and were phagocytized by macrophages (arrows), but no cells differentiated into NeuN-positive neurons (A). Graphs show the numbers of GFAP+GFP+ (B), CD11b+GFP+ (C), and GFP-MSCs (D) in animals grafted with polymersome-labeled GFP-MSCs and unlabeled GFP-MSCs. Bar =15 µm.
Abbreviation: MSC, mesenchymal stem cell.
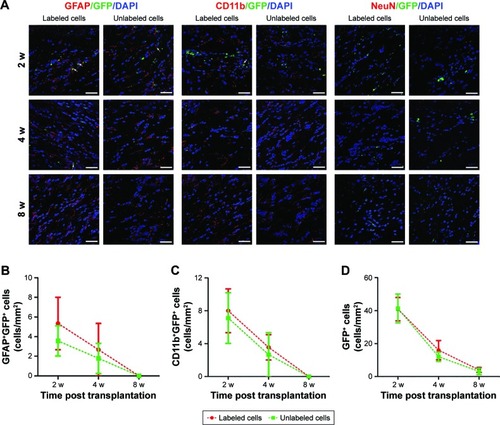
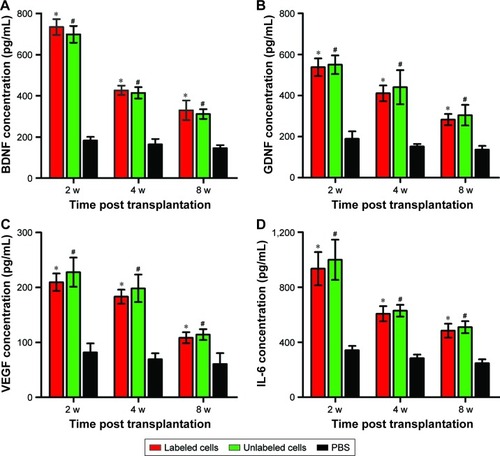
Figure 10 ELISA of grafted MSCs.
Notes: Graphs show the concentration levels of BDNF (A), GDNF (B), VEGF (C), and IL-6 (D) in animals grafted with polymersome-labeled GFP-MSCs, unlabeled GFP-MSCs, and PBS. *p<0.05 between labeled GFP-MSCs and PBS; #p<0.05 between unlabeled GFP-MSCs and PBS.
Abbreviations: IL, interleukin; MSC, mesenchymal stem cell; PBS, phosphate-buffered saline.