Figures & data
Figure 1 CH-based nanoparticles did not affect cell viability.
Notes: HeLa cells were treated for 24 h with 5 µg free siRNA-TNFα, CH-DEAE15-CH/siRNA-TNFα or folate-PEG-CH-DEAE15/siRNA-TNFα complexes containing an equivalent of 5 µg siRNA-TNFα. Cell viability was evaluated by MTT assay. The results were compared by paired Student’s t-test and expressed as means ± SEM for n=3.
Abbreviations: CH, chitosan; DEAE, diethylethylamine; PEG, polyethylene glycol; SEM, standard error of the means; TNFα, tumor necrosis factor-alpha.
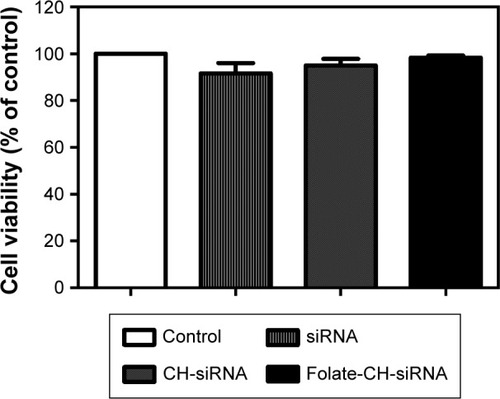
Table 1 Arthritis and therapeutic effects in mice on day 10
Figure 2 Arthritis progression and the therapeutic effects of CH-DEAE15/siRNA-TNFα, folate-PEG-CH-DEAE15/siRNA-TNFα and naked siRNA-TNFα nanoparticles in a murine CAIA model.
Notes: (A) Joint inflammation in mice was measured by an arthritic scoring methodCitation22 to verify disease progression on a scale of 0–4 for each paw, for a total score of 0–16 for all four paws. On the first day (day 1), arthritis was induced by ip injection of a 1.5 mg cocktail of arthritogenic mAb against type II collagen. Two days later (day 3), mice received an ip injection with 50 µg Escherichia coli (0.5 mg/mL stock) lipopolysaccharide. At the same time on days 1, 3, 5 and 7, mice received an ip injection with 100 µL of nanoparticles containing the equivalent of 50 µg siRNA-TNFα. (B) Arthritic score on day 10. (C) Arthritis development estimated by measuring hind paw thickness over the course of the experiment. (D) Hind paw thickness on day 10. (E) Hind paws of mice on day 10. Statistical significance was assessed by unpaired Student’s t-test, *P<0.05, ***P<0.001. Each group contained eight mice except group 5 which only had five mice. Group 1: normal control; group 2: CAIA control; group 3: CAIA mice treated with CH-DEAE15/siRNA-TNFα nanoparticles; group 4: CAIA mice treated with folate-PEG-CH-DEAE15/siRNA-TNFα nanoparticles; group 5: CAIA mice treated with siRNA-TNFα.
Abbreviations: CAIA, collagen antibody-induced arthritis; CH, chitosan; DEAE, diethylethylamine; ip, intraperitoneal; mAb, monoclonal antibody; ND, not determined; PEG, polyethylene glycol; SEM, standard error of the means; TNFα, tumor necrosis factor-alpha.
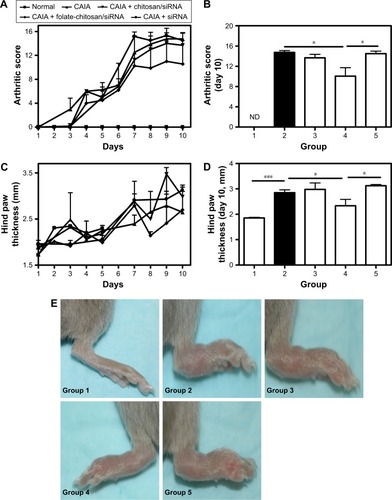
Table 2 Histologic examination scores, CTX-II and TNFα levels
Figure 3 Histologic examination and cartilage destruction marker.
Notes: (A) Hematoxylin–eosin-, safranin O- and toluidine blue-stained images of the hind knee joints of mice from different groups. Knee sections were fixed, sectioned, stained and finally observed by light microscopy at 20× magnification. Severity scores of (B) synovitis, (C) bone erosion and (D) cartilage destruction were assessed on day 10 by two investigators blinded to origin of the samples and using the already-described scoring method.Citation39 (E) Serum levels of CTX-II degradation products measured by ELISA. Values are the means ± SEM of eight mice (groups 1–4) and five mice (group 5). Statistical significance was assessed by unpaired Student’s t-test, *P<0.05, **P<0.01. Group 1: normal control; group 2: CAIA control; group 3: CAIA mice treated with CH-DEAE15/siRNA-TNFα nanoparticles; group 4: CAIA mice treated with folate-PEG-CH-DEAE15/siRNA-TNFα nanoparticles; group 5: CAIA mice treated with siRNA-TNFα.
Abbreviations: CAIA, collagen antibody-induced arthritis; CH, chitosan; CTX-II, C-terminal telopeptide type II collagen; DEAE, diethylethylamine; ELISA, enzyme-linked immunosorbent assay; ND, not determined; PEG, polyethylene glycol; SEM, standard error of the means; TNFα, tumor necrosis factor-alpha.
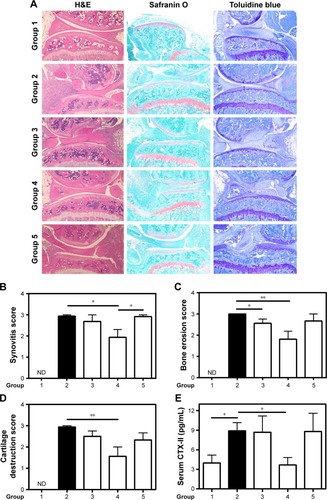
Figure 4 TNFα expression.
Notes: (A) TNFα concentrations were determined by ELISA in tissue homogenates of knee joints. (B) Immunostaining of TNFα-positive chondrocytes (black arrows). (C) Total and positive-stained chondrocytes were counted and presented as percentages. Values are the means ± SEM of eight mice (groups 1–4) and five mice (group 5). Statistical significance was assessed by unpaired Student’s t-test, *P<0.05, **P<0.01, ***P<0.001. Group 1: normal control; group 2: CAIA control; group 3: CAIA mice treated with CH-DEAE15/siRNA-TNFα nanoparticles; group 4: CAIA mice treated with folate-PEG-CH-DEAE15/siRNA-TNFα nanoparticles; group 5: CAIA mice treated with siRNA-TNFα.
Abbreviations: CAIA, collagen antibody-induced arthritis; CH, chitosan; CTX-II, C-terminal telopeptide type II collagen; DEAE, diethylethylamine; ELISA, enzyme-linked immunosorbent assay; PEG, polyethylene glycol; SEM, standard error of the means; TNFα, tumor necrosis factor-alpha.
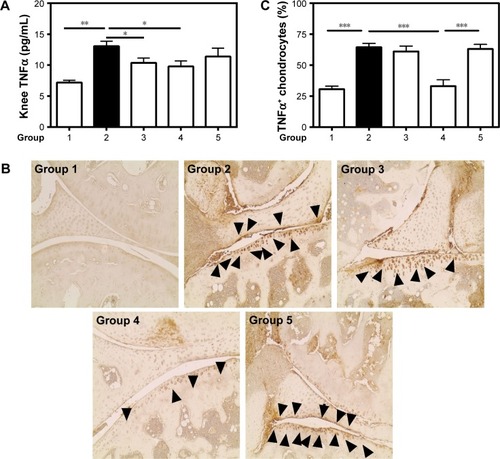
Figure 5 Micro-CT analysis.
Notes: (A) Representative trabecular bone in micro-CT images of the distal femur in mice from different groups. (B) Cortical BMD in femur diaphysis. (C) Trabecular bone volume as percentage of total volume (BV/TV). (D) TbTh. (E) TbN. (F) TbSp. n=3. Values are the means ± SEM of three mice. Statistical significance was assessed by unpaired Student’s t-test, *P<0.05, **P<0.01, ***P<0.001. Group 1: normal control; group 2: CAIA control; group 3: CAIA mice treated with CH-DEAE15/siRNA-TNFα nanoparticles; group 4: CAIA mice treated with folate-PEG-CH-DEAE15/siRNA-TNFα nanoparticles; group 5: CAIA mice treated with siRNA-TNFα.
Abbreviations: BMD, bone mineral density; BV, bone volume; CAIA, collagen antibody-induced arthritis; CH, chitosan; CTX-II, C-terminal telopeptide type II collagen; DEAE, diethylethylamine; ELISA, enzyme-linked immunosorbent assay; micro-CT, micro-computed tomography; PEG, polyethylene glycol; SEM, standard error of the means; TbN, trabecular bone number; TbSp, trabecular separation; TbTh, trabecular bone thickness; TNFα, tumor necrosis factor-alpha; TV, tissue volume.
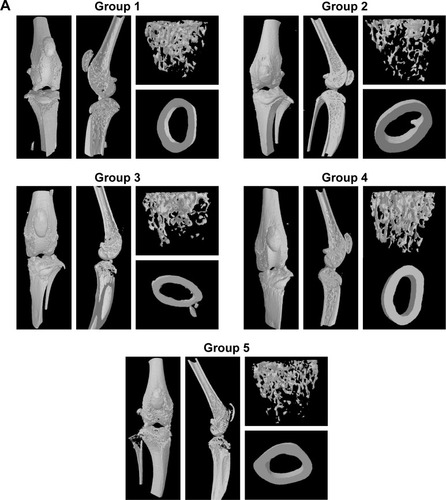
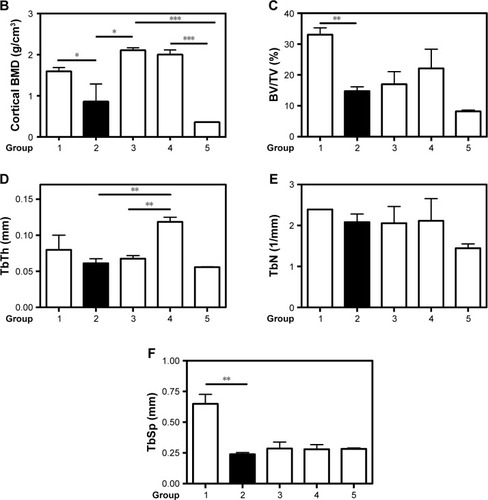
Table 3 Biomarkers of bone formation and bone resorption
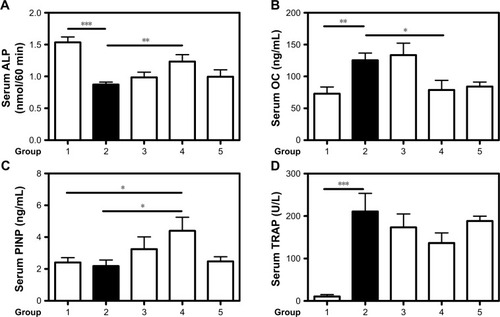
Figure 6 Biomarkers of bone formation and resorption.
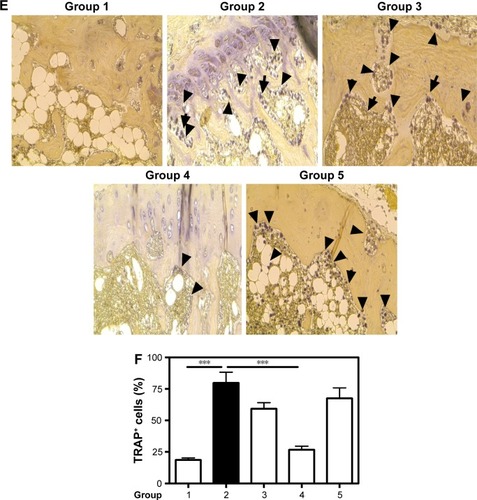
Notes: Therapeutic effect of CH-DEAE15/siRNA-TNFα, folate-PEG-CH-DEAE15/siRNA-TNFα and naked siRNA-TNFα nanoparticles on serum bone marker levels in CAIA mice. (A) Serum ALP on day 10. (B) Serum OC on day 10. (C) Serum PINP on day 10. (D) Serum TRAP levels. (E) Immunostaining showing TRAP-positive cells indicated by black arrows. (F) Percentage of TRAP-positive cells in each group. Statistical significance was assessed by unpaired Student’s t-test, *P<0.05, **P<0.01, ***P<0.001. Group 1: normal control; group 2: CAIA control; group 3: CAIA mice treated with DEAE15-CH/siRNA-TNFα nanoparticles; group 4: CAIA mice treated with folate-PEG-CH-DEAE15/siRNA-TNFα nanoparticles; group 5: CAIA mice treated with siRNA-TNFα.
Abbreviations: ALP, alkaline phosphatase; CAIA, collagen antibody-induced arthritis; CH, chitosan; CTX-II, C-terminal telopeptide type II collagen; DEAE, diethylethylamine; ELISA, enzyme-linked immunosorbent assay; OC, osteocalcin; PEG, polyethylene glycol; PINP, procollagen I N-terminal peptide; SEM, standard error of the means; TNFα, tumor necrosis factor-alpha; TRAP, tartrate-resistant acid phosphatase.
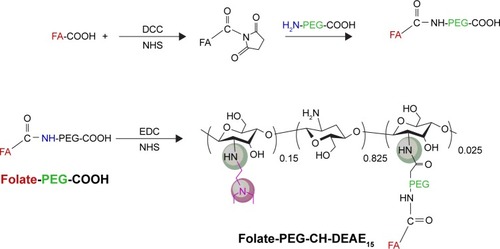
Scheme 1 Synthetic scheme for the synthesis of the folic acid-labeled diethylaminoethyl-chitosan.
Abbreviations: CH, chitosan; DCC, dicyclohexylcarbodiimide; DEAE, diethylethylamine; EDC, 1-ethyl-3-(3-dimethylaminopropyl)carbodiimide; FA, folic acid; NHS, N-hydroxysuccinimide; PEG, polyethylene glycol.