Figures & data
Figure 1 Characterization of PEG-b-(PELG-g-PZLL) and QUE/P.
Notes: (A) a, PEG-b-PBLG; b, PEG-b-PELG; c, PEG-b-(PELG-G-PZLL). FTIS of PEG-b-(PELG-g-PZLL); (B) TEM image of QUE/P; (C) a, particle size of P; b, particle size of QUE/P; (D) cumulative release profile of QUE/P; (E) cellular viability of HeLa cells cultured with different concentrations of PEG-b-(PELG-g-PZLL); (F) blood concentration of free QUE and QUE from QUE/P; (G) solution color of QUE and QUE/P.
Abbreviations: PEG-b-(PELG-g-PZLL), poly(ethylene glycol)-b-(poly(ethylenediamine l-glutamate)-g-poly(ε-benzyloxycarbonyl-l-lysine)); QUE/P, quercetin/PEG-b-(PELG-g-PZLL); FTIS, Fourier transform infrared spectroscopy; TEM, transmission electron microscopy.
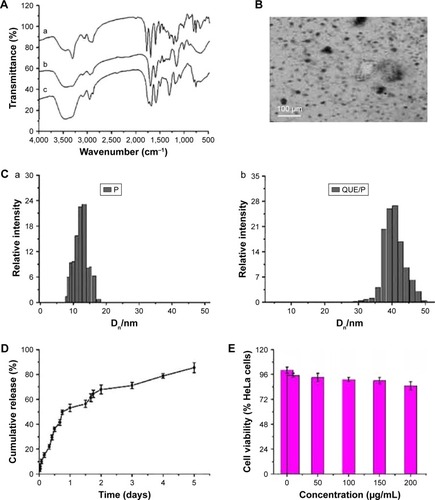
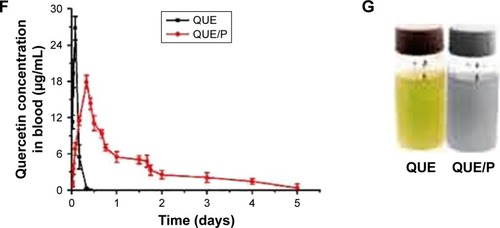
Table 1 Molecular weight, PDI, TEM, particle size, and QUE-loading capacity of P
Figure 2 The distribution of quercetin/PEG-b-(PELG-g-PZLL) compound in rats.
Note: The distribution of quercetin/PEG-b-(PELG-g-PZLL) in rats and results expressed as mean ± standard deviation.
Abbreviations: PEG-b-(PELG-g-PZLL), poly(ethylene glycol)-b-(poly(ethylenediamine l-glutamate)-g-poly(ε-benzyloxycarbonyl-l-lysine)); DPM, disintegrations per minute.
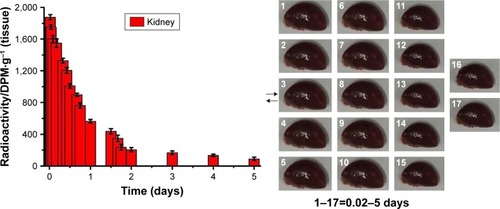
Figure 3 Histopathologic assessment of kidney damage.
Notes: Light microscope images (×400) in Sham group, DN group, QUE group, QUE/P group, respectively (A); quantitative injury scores, expressed as mean ± SD, are shown in (B); gross appearance in Sham group, DN group, QUE group, QUE/P group, respectively (C). A remarkable augment relative to Sham group is denoted by “*” (p<0.01), a remarkable decrease relative to DN group is denoted by “**” (p<0.01), and a remarkable decrease relative to DN group is denoted by “***” (p<0.01).
Abbreviations: DN, diabetic nephropathy; QUE/P, quercetin/poly(ethylene glycol)-b-(poly(ethylenediamine l-glutamate)-g-poly(ε-benzyloxycarbonyl-l-lysine)); SD, standard deviation.
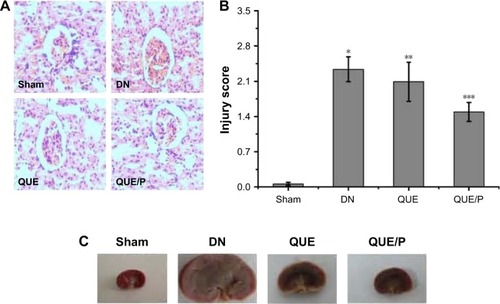
Figure 4 The activity of SOD and the levels of blood glucose, BUN, Scr, MDA, HDL, LDL, TG, urine protein, and albumin/creatinine ratio.
Notes: (A) Level of blood glucose in control group, QUE group, QUE/P group, respectively; (B) level of BUN in Sham group, DN group, QUE group, QUE/P group, respectively; (C) level of Scr in Sham group, DN group, QUE group, QUE/P group, respectively; (D) activity of SOD in Sham group, DN group, QUE group, QUE/P group, respectively; (E) level of MDA in Sham group, DN group, QUE group, QUE/P group, respectively; (F) level of HDL, LDL, and TG in Sham group, DN group, QUE group, QUE/P group, respectively; (G) level of urine protein in Sham group, DN group, QUE group, QUE/P group, respectively; (H) albumin/creatinine ratio. (B, C, E, F-LDL and TG, G, H) A remarkable augment relative to the Sham group is denoted by “*” (p<0.01), a remarkable decrease relative to DN group is denoted by “**” (p<0.01), and a remarkable decrease relative to DN group is denoted by “***” (p<0.01); (D, F-HDL) a remarkable decrease relative to the Sham group is denoted by “*” (p<0.01), a remarkable increase relative to DN group is denoted by “**” (p<0.01), and a remarkable increase relative to DN group is denoted by “***” (p<0.01).
Abbreviations: SOD, superoxide dismutase; BUN, blood urea nitrogen; Scr, serum creatinine; MDA, malonyldialdehyde; HDL, high-density lipoprotein; LDL, low-density lipoprotein; TG, triglyceride; QUE/P, quercetin/poly(ethylene glycol)-b-(poly(ethylenediamine l-glutamate)-g-poly(ε-benzyloxycarbonyl-l-lysine)); DN, diabetic nephropathy.
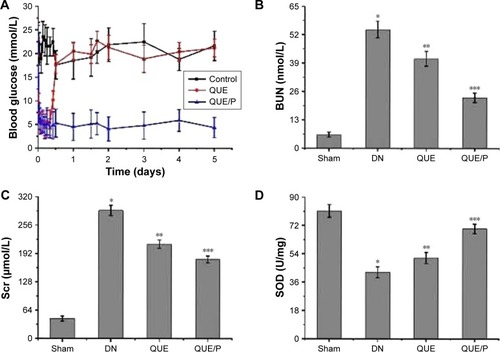
Figure 5 QUE/P inhibits neutrophil adhesion in vivo (immunofluorescence photomicrographs).
Notes: (A) The image displaying CFSE-labeled HL-60 adhesion to HUVECs. HUVECs are administrated with QUE, QUE/P, and control oligonucleotide for 24 h and then administrated with or without TNF-α for 6 h. CFSE-labeled HL-60 are put into the HUVECs and incubated at 37°C for 45 min, and then the mixtures were washed. (B) Amount of neutrophil (CFSE-labeled HL-60) adhering to HUVECs in NC group, NC + TNF-α group, QUE + TNF-α group, QUE/P + TNF-α group, respectively. Data are shown as mean ± SD. A remarkable augment relative to the NC group is denoted by “*” (p<0.01), a remarkable decrease relative to NC + TNF-α group is denoted by “**” (p<0.01), and a remarkable decrease relative to NC + TNF-α group is denoted by “***” (p<0.01).
Abbreviations: QUE/P, quercetin/poly(ethylene glycol)-b-(poly(ethylenediamine l-glutamate)-g-poly(ε-benzyloxycarbonyl-l-lysine)); CFSE, carboxyfluorescein diacetate succinimidyl ester; HL-60, acute promyelocytic leukemia; HUVECs, human umbilical vein endothelial cells; TNF-α, tumor necrosis factor-α; SD, standard deviation; NC, normal control.
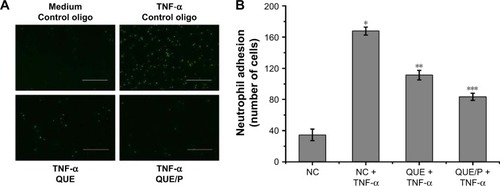
Figure 6 QUE/P downregulates ICAM-1 expression in vivo.
Notes: (A) Expression of ICAM-1 in PBS group, NC group, QUE group, QUE/P group, respectively. (B) Expression of ICAM-1 in DN+1 week group, DN+2 week group, DN+4 week group, DN+8 week group, respectively. (C) Expression of ICAM-1 in Sham group, DN group, QUE group, QUE/P group, respectively. A remarkable decrease relative to the NC group is denoted by “*” (p<0.01), a remarkable decrease relative to NC group is denoted by “**” (p<0.01) (A); a remarkable augment relative to the DN+1 week group is denoted by “*” (p<0.01), a remarkable increase relative to DN+2 week group is denoted by “**” (p<0.01), and a remarkable increase relative to DN+4 week group is denoted by “***” (p<0.01) (B); a remarkable augment relative to the DN group is denoted by “*” (p<0.01), a remarkable decrease relative to DN group is denoted by “**” (p<0.01), and a remarkable decrease relative to DN group is denoted by “***” (p<0.01) (C).
Abbreviations: QUE/P, quercetin/poly(ethylene glycol)-b-(poly(ethylenediamine l-glutamate)-g-poly(ε-benzyloxycarbonyl-l-lysine)); ICAM-1, intercellular adhesion molecular-1; PBS, phosphate-buffered saline; DN, diabetic nephropathy; NC, normal control.
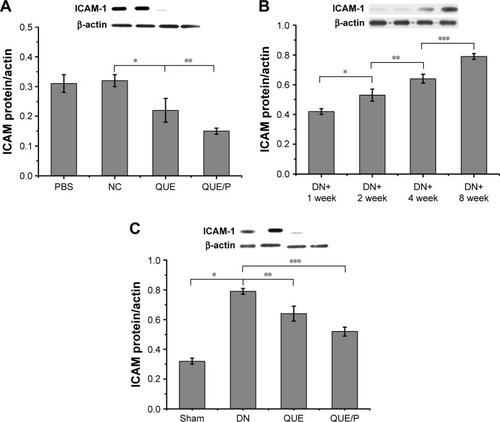
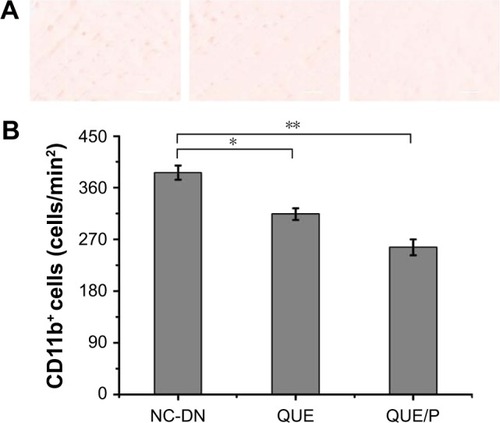
Figure 7 QUE/P decreases inflammatory cell infiltration to the DN.
Notes: (A) Image of immunohistochemical staining for CD11b+ myeloid cells in NC-DN group, QUE group, QUE/P group, respectively; (B) quantitative value in NC-DN group, QUE group, QUE/P group, respectively. A remarkable decrease relative to the NC-DN group is denoted by “*” (p<0.01) and a remarkable decrease relative to NC-DN group is denoted by “**” (p<0.01).
Abbreviations: QUE/P, quercetin/poly(ethylene glycol)-b-(poly(ethylenediamine l-glutamate)-g-poly(ε-benzyloxycarbonyl-l-lysine)); DN, diabetic nephropathy; NC, normal control.
Scheme 1 The structure of quercetin/PEG-b-(PELG-g-PZLL).
Abbreviation: PEG-b-(PELG-g-PZLL), poly(ethylene glycol)-b-(poly(ethylenediamine l-glutamate)-g-poly(ε-benzyloxycarbonyl-l-lysine)).
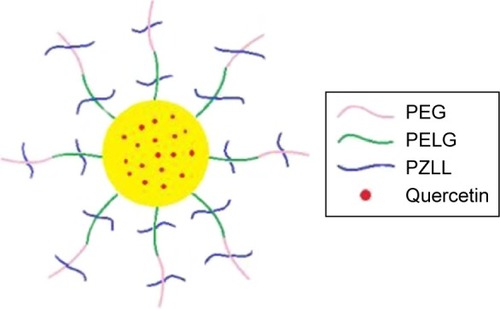
Figure S1 Synthesis of PEG-b-(PELG-g-PZLL).
Abbreviations: PEG-NH2, poly(ethylene glycol) amine; PEG-b-PBLG, poly(ethylene glycol)-b-poly(γ-benzyl l-glutamate); PEG-b-PELG, poly(ethylene glycol)-b-poly(ethylen-ediamine l-glutamate); PEG-b-(PELG-g-PZLL), poly(ethylene glycol)-b-(poly(ethylenediamine l-glutamate)-g-poly(ε-benzyloxycarbonyl-l-lysine)).
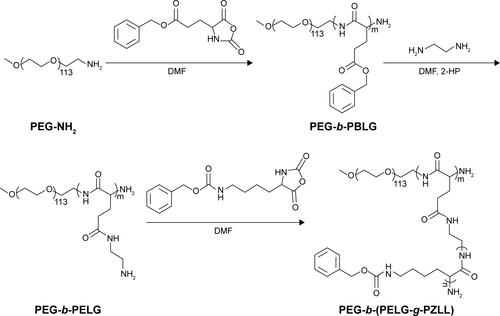
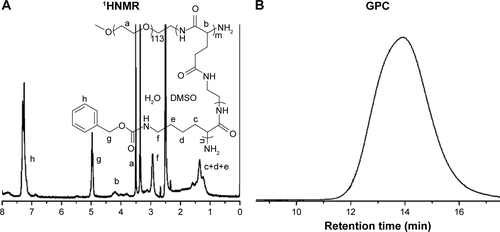
Figure S2 Characterization of PEG-b-(PELG-g-PZLL).
Notes: (A) 1HNMR of PEG-b-(PELG-g-PZLL); (B) GPCs of PEG-b-(PELG-g-PZLL).
Abbreviations: PEG-b-(PELG-g-PZLL), poly(ethylene glycol)-b-(poly(ethylenediamine l-glutamate)-g-poly(ε-benzyloxycarbonyl-l-lysine)); 1HNMR, 1H-nuclear magnetic resonance; GPC, gel permeation chromatogram.