Figures & data
Table 1 Composition of formulations selected for characterization
Figure 1 Ternary-phase diagram.
Notes: Polyoxypropylene-(5)-polyoxyethylene-(20)-cetyl alcohol (PPG-5-Ceteth-20), oleic acid, and 0.5% C974P dispersion (0.5% C974P). F1C, F2C, and F3C were the formulations selected for structural characterization.
Abbreviations: TLS, transparent liquid system; TrLS, translucent liquid systems; TVS, transparent viscous system; TrVS, translucent viscous system; OVS, opaque viscous system; PS, phase separation.
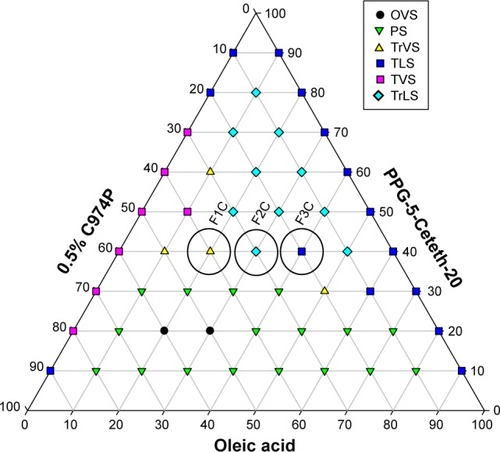
Figure 2 Polarized light microscopy of formulations F1C (A), F2C (B), and F3C (C). Magnification 20×.
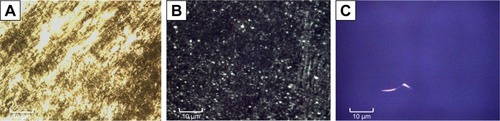
Figure 3 Small-angle X-ray scattering results obtained for formulations F1C, F2C and F3C.
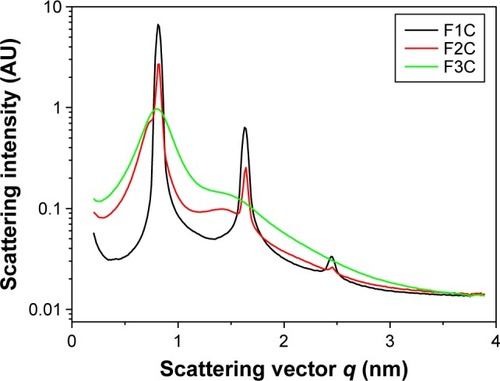
Table 2 Values of qmax (Å) and distance (d) between lamellae
Table 3 Flow behavior (n) and consistency index (κ) of the formulations
Figure 4 Flow properties of formulations F1C, F2C, and F3C.
Notes: The flow properties were determined using a controlled shear rate procedure ranging from 0.01 to 100 s−1 (or ascendent curve – filled symbols) and back (or descendant curve - empty symbols).
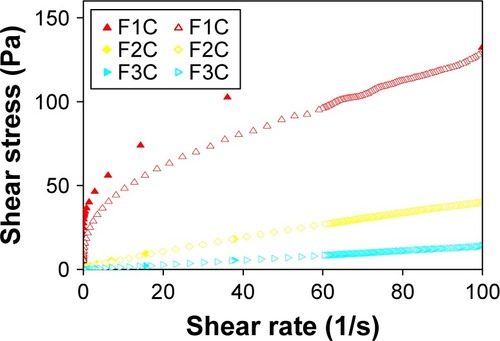
Table 4 Strength (S) and the viscoelastic exponent (n) of the formulations
Figure 5 Variations in storage moduli (G′; filled symbols) and loss moduli (G′′; empty symbols) as a function of frequency for F1C, F2C, and F3C.
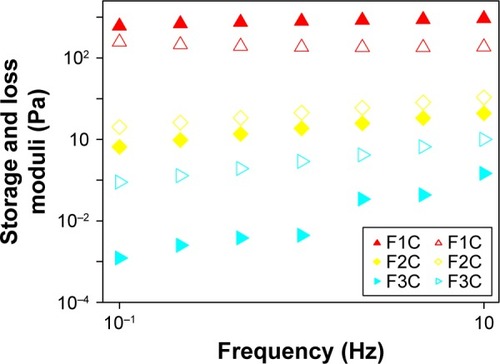
Table 5 Work of bioadhesive force (mN⋅s) of the formulations. Values represent mean ± SD at 37°C
Figure 6 Quantification of Streptococcus mutans biofilm biomass after 24 hours treatment in the surface-bound salivary phase.
Notes: Bars indicate minimum and maximum values. Boxes indicate lower and upper quartiles, respectively. Lines in the middle of boxes are medians (n=12). Different uppercase letters indicate statistical differences among the groups, according to Kruskal–Wallis/Mann–Whitney tests (P<0.05).
Abbreviations: F, liquid-crystalline formulation; p1025, peptide p1025; Chx, chlorhexidine.
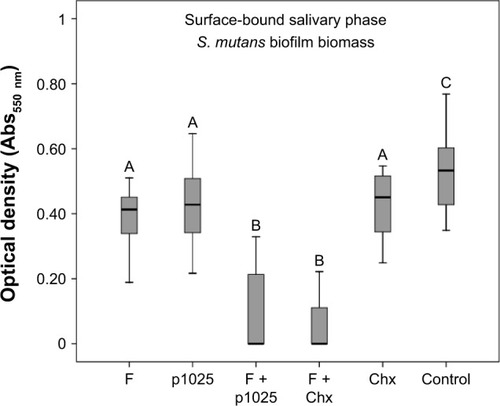
Figure 7 Quantification of Streptococcus mutans biofilm biomass 24 hours after treatment in the salivary fluid phase.
Notes: Bars indicate minimum and maximum values. Boxes indicate lower and upper quartiles, respectively. Lines in the middle of boxes are medians (n=12). Different uppercase letters indicate statistical differences among the groups, according to Kruskal–Wallis/Mann–Whitney tests (P<0.05).
Abbreviations: F, liquid-crystalline formulation; p1025, peptide 1025; Chx, chlo-rhexidine.
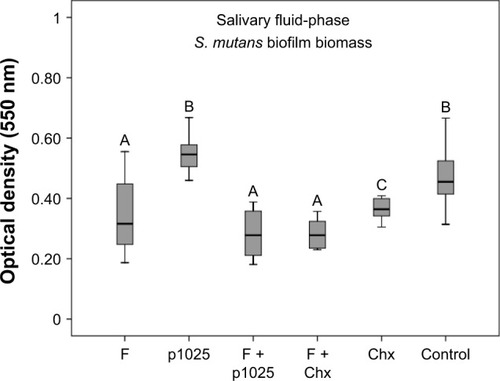
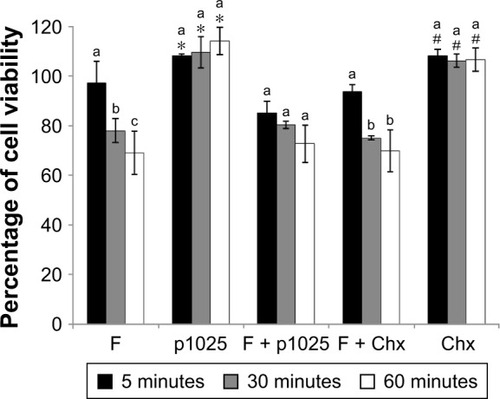
Figure 8 Epithelial cell viability after 5, 30, and 60 minutes of treatment and growth for 24 hours.
Notes: *Significant difference between p1025 and the other groups (F, F + p1025, F + Chx), except for Chx, considering each time of exposure separately, according to ANOVA/Tukey’s tests; #significant difference between Chx and the other groups (F, F + p1025, F + Chx), except for p1025, considering each time of exposure separately, according to ANOVA/Tukey’s tests. Columns indicate means and bars indicate standard deviations (n=12). Different letters show significant differences among times of exposure (5, 30, or 60 minutes), considering each group separately, according to ANOVA/Tukey’s tests.
Abbreviations: F, liquid-crystalline formulation; p1025, peptide p1025; Chx, chlorhexidine; ANOVA, analysis of variance.