Figures & data
Figure 1 SEM images of the samples.
Notes: (A) Native SiO2 NPs. (B) SiO2–gentamicin nanohybrids.
Abbreviations: SEM, scanning electron microscope; SiO2, silica; NPs, nanoparticles.
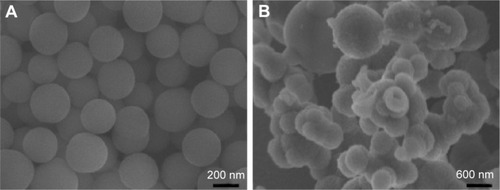
Figure 2 TEM images and size-distribution histograms of the samples.
Notes: TEM images of the (A) native SiO2 NPs and (B) SiO2–gentamicin nanohybrids. Size-distribution histograms of the (C) native SiO2 NPs and (D) SiO2–gentamicin nanohybrids generated from images (A) and (B), respectively. Most of the native SiO2 NPs are well dispersed (A). The average size of native SiO2 NPs calculated from the TEM image is 312±26 nm, with a size distribution of 265–405 nm (C). The size of the SiO2–gentamicin nanohybrids increases markedly, compared with the size of the native SiO2 NPs (B). The average size of SiO2–gentamicin nanohybrids is 719±128 nm, and the size distribution ranges from 495 to 965 nm (D).
Abbreviations: TEM, transmission electron microscope; SiO2, silica; NPs, nanoparticles.
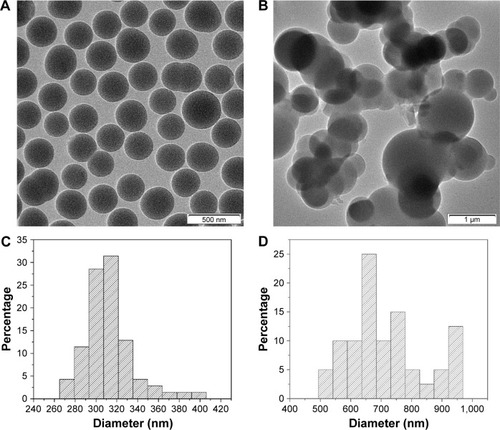
Figure 3 FTIR spectra and TGA of the samples.
Notes: (A) FTIR spectra of the native SiO2 NPs, SiO2–gentamicin nanohybrids, and free gentamicin. (B) TGA of the native SiO2 NPs and SiO2–gentamicin nanohybrids.
Abbreviations: FTIR, Fourier-transform infrared; TGA, thermogravimetric analysis; SiO2, silica; SiO2–G, SiO2–gentamicin nanohybrids; NPs, nanoparticles; G, gentamicin.
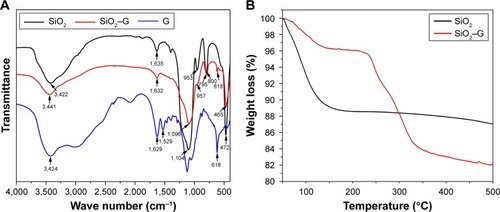
Figure 4 Cell viability detected by CCK-8 assay.
Notes: (A) The cells were incubated in the normal medium for 1, 3, and 5 days. (B) The cells were incubated in the osteogenic induction medium for 7 and 14 days. The values are expressed as mean ± SD of triplicate experiments. *p<0.05 compared with the control group. **p<0.01 compared with the control group.
Abbreviations: CCK-8, Cell Count Kit-8; SiO2, silica; SiO2–G, SiO2–gentamicin nanohybrids; G, gentamicin.
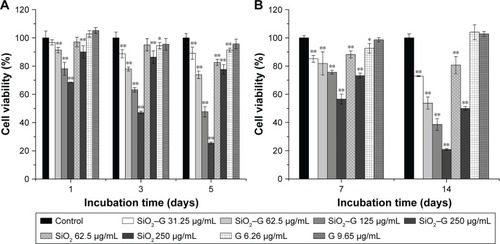
Figure 5 Calcein-AM staining for living cells.
Notes: The cells were incubated with different concentrations of native SiO2 NPs, SiO2–gentamicin nanohybrids, and free gentamicin in the normal medium for 1, 3, and 5 days. The images are representative of three independent experiments.
Abbreviations: SiO2, silica; SiO2–G, SiO2–gentamicin nanohybrids; NPs, nanoparticles; G, gentamicin.
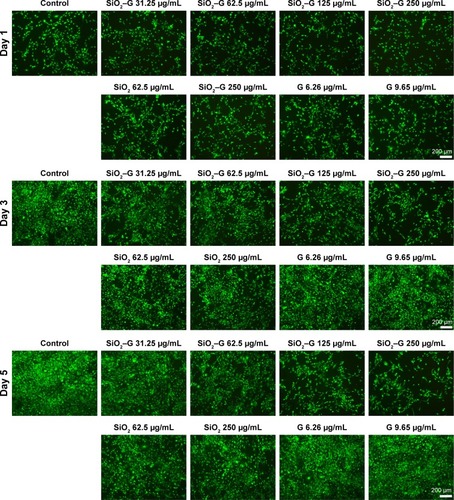
Figure 6 ALP activity of the SaOS-2 cells.
Notes: (A) Optical microscopic images and (B) macrograph of ALP staining. (C) ALP activity of SaOS-2 cells after osteogenic induction for 7 days. Values are expressed as mean ± SD of the triplicate experiments. **p<0.01 compared with the control group.
Abbreviations: ALP, alkaline phosphatase; SiO2, silica; SiO2–G, SiO2–gentamicin nanohybrids; G, gentamicin.
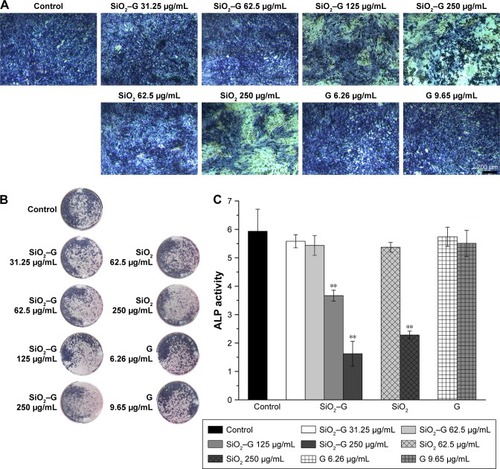
Figure 7 Collagen secretion of the SaOS-2 cells.
Notes: (A) Optical microscopic images and (B) macrograph of Sirius Red staining for the collagen secretion of cells after osteogenic induction for 7 days. (C) The quantitative results of retention of Sirius Red. Data are expressed as mean ± SD (n=3 for each sample). *p<0.05 compared with the control group.
Abbreviations: SiO2, silica; SiO2–G, SiO2–gentamicin nanohybrids; G, gentamicin.
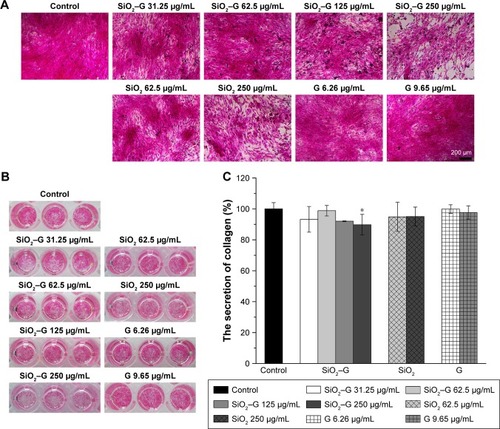
Figure 8 Expression of COLI, OPN, and OCN of the SaOS-2 cells.
Notes: Immunofluorescent staining for COLI, OPN, and OCN. The cells were incubated with different concentrations of native SiO2 NPs, SiO2–gentamicin nanohybrids, and free gentamicin in the osteogenic induction medium for 7 days (for COLI and OPN) and 14 days (for OCN). The images are representative of three independent experiments.
Abbreviations: COLI, type I collagen; OPN, osteopontin; OCN, osteocalcin; SiO2, silica; SiO2–G, SiO2–gentamicin nanohybrids; NPs, nanoparticles; G, gentamicin.
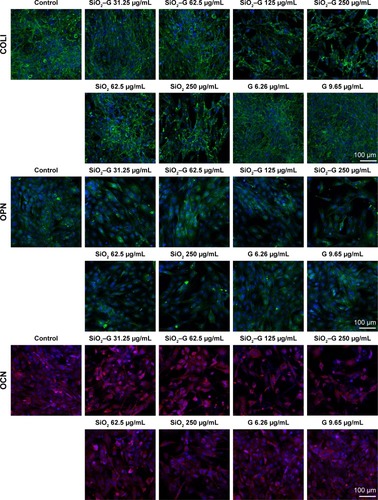
Figure 9 ECM mineralization of the SaOS-2 cells.
Notes: (A) Optical microscopic images and (B) macrograph of Alizarin Red S staining for matrix mineralization of cells after osteogenic induction for 14 days. (C) The quantitative results of retention of Alizarin Red S. Data are expressed as mean ± SD (n=3 for each sample). **p<0.01 compared with the control group.
Abbreviations: ECM, extracellular matrix; SiO2, silica; SiO2–G, SiO2–gentamicin nanohybrids; G, gentamicin.
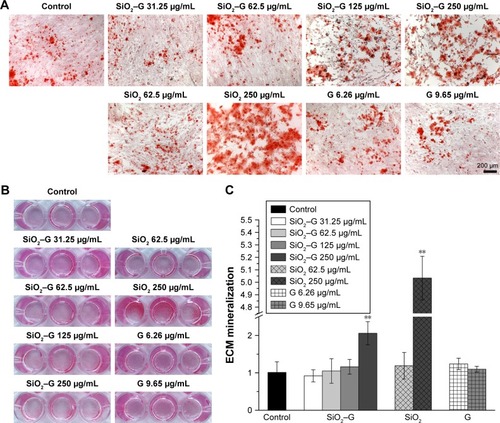
Figure S1 Concentration of Si ions for the samples incubated in the cell culture medium.
Notes: The SiO2–gentamicin nanohybrids and native SiO2 NPs at a concentration of 250 μg/mL were incubated in osteogenic induction medium. On days 3, 6, 9, 12, and 15, the medium containing the released Si ions was collected and then analyzed by ICP-MS. **p<0.01 compared with the SiO2 NPs.
Abbreviations: SiO2, silica; SiO2–G, SiO2–gentamicin nanohybrids; G, gentamicin; NPs, nanoparticles; ICP-MS, inductively coupled plasma mass spectrometry.
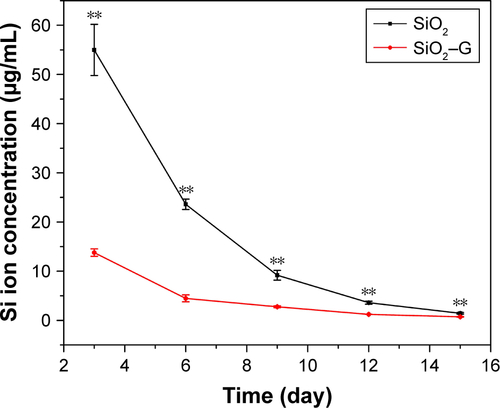
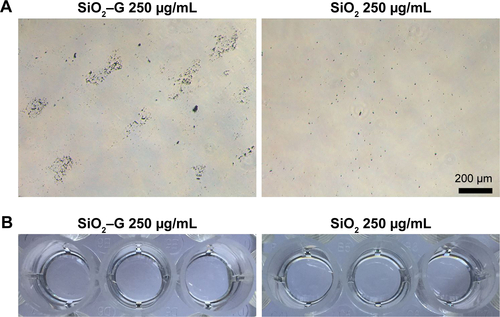
Figure S2 Optical microscopic images of cells.
Notes: The cells were incubated with different concentrations of SiO2–G nanohybrids, SiO2 NPs, and G for 24 h in the osteogenic induction medium.
Abbreviations: SiO2, silica; SiO2–G, SiO2–gentamicin nanohybrids; G, gentamicin; NPs, nanoparticles.
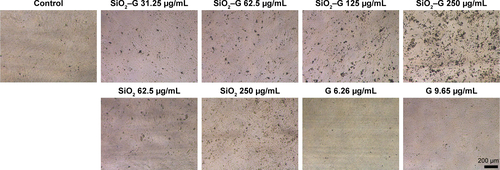
Figure S3 Mineralization of the SiO2–G and SiO2 NPs.
Notes: (A) Optical microscopic images and (B) macrograph of Alizarin Red S staining for mineralization of SiO2–G nanohybrids and SiO2 NPs at a concentration of 250 μg/mL (in the absence of cells) after osteogenic induction for 14 days.
Abbreviations: SiO2, silica; SiO2–G, SiO2–gentamicin nanohybrids; G, gentamicin; NPs, nanoparticles.