Figures & data
Figure 1 (A) Citation1H NMR spectra of mPEG-g-PEI and (B) FTIR of mPEG-g-PEI.
Abbreviations: Citation1H NMR, proton nuclear magnetic resonance; mPEG-g-PEI, polyethylene glycol methyl ether grafted polyethylenimine; FTIR, Fourier transform infrared.
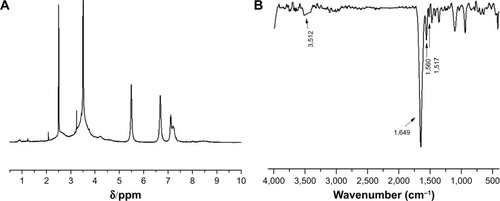
Figure 2 (A) Zeta potential and (B) particle size of mPEG-g-PEI/miR-135a with different N/P ratios. (C) Agarose gel electrophoresis of mPEG-g-PEI/miR-135a at different N/P ratios and (D) transmission electron microscopic images of mPEG-g-PEI/miR-135a at an N/P ratio of 6 (bar =500 nm).
Abbreviation: mPEG-g-PEI, polyethylene glycol methyl ether grafted polyethylenimine.
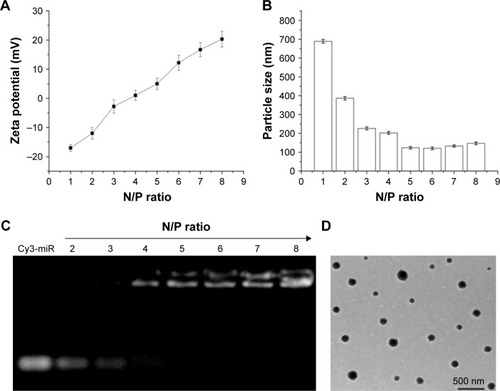
Figure 3 (A) Detection of stability of mPEG-g-PEI/miR-135a by electrophoresis at different incubation time points of miR-135a mimic and mPEG-g-PEI/miR-135a in serum and (B) release curves of mPEG-g-PEI/miR-135a in acidic and neutral solutions.
Abbreviation: mPEG-g-PEI, polyethylene glycol methyl ether grafted polyethylenimine.
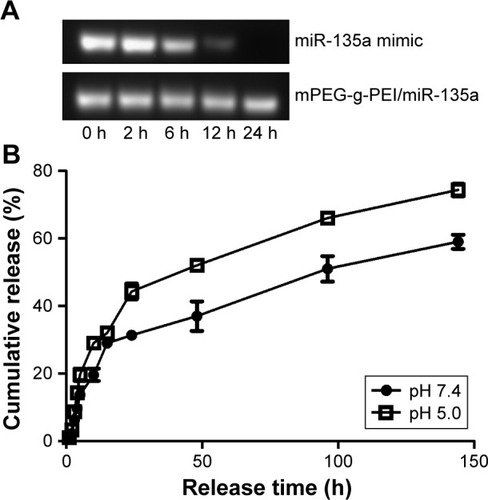
Figure 4 (A) mPEG-g-PEI toxicity against astrocytes and C6 cells at different concentrations. (B) CLSM image of C6 cells after mPEG-g-PEI/Cy3-miR-135a transfection at 2 h, 4 h, and 6 h. (A1, B1, and C1 are DAPI-blue; A2, B2, and C2 are Cy3-red; A3, B3, and C3 are merged images). (C) Flow cytometric quantitation of Cy3-miR-135a uptake by C6 cells at different time points (the number of positive cells detected at 2 h, 4 h, and 6 h on the left and the average intensity of fluorescence at the corresponding time point on the right). (D) RT-PCR analysis measuring miR-135a levels in astrocyte and C6 cells after mPEG-g-PEI and Lipo3000 transfection in vitro (*P<0.05).
Abbreviations: mPEG-g-PEI, polyethylene glycol methyl ether grafted polyethylenimine; RT-PCR, real-time polymerase chain reaction; DAPI, 4′,6-diamidino-2-phenylindole.
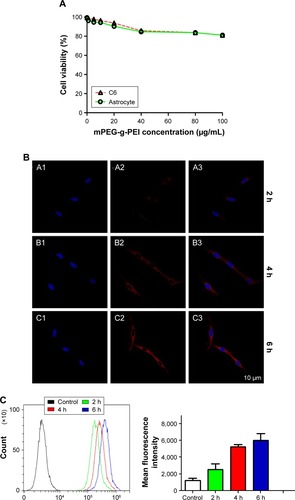
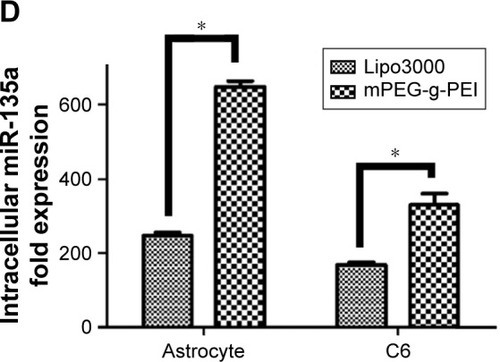
Figure 5 (A) Kaplan–Meier survival curves of miR-135a treatment in C6 rat models (n=8 for each group). (B) MRI on day 28 post-inoculation: (a) blank control group, (b) negative control group, (c) AgomiR-135a group, and (d) mPEG-g-PEI/miR-135a group. (C) H&E staining of brain sections in different groups: (a) blank control group, (b) negative control group, (c) Agomir-135a group, and (d) mPEG-g-PEI/miR-135a group. (D) The average tumor volume in different groups on day 28 post-inoculation (*P<0.05).
Abbreviations: MIR, magnetic resonance imaging; H&E, hematoxylin and eosin; mPEG-g-PEI, polyethylene glycol methyl ether grafted polyethylenimine; NC, negative control.
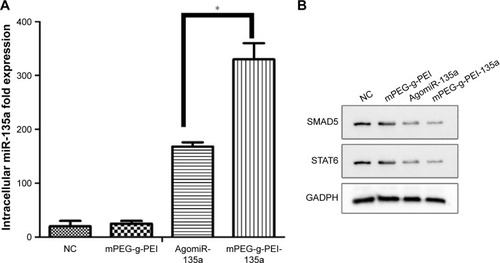
Figure 6 (A) Analysis of miR-135a expression by RT-PCR in different groups (*P<0.05). (B) Western blot analysis of the expression of SMAD5 and STAT6 levels in the C6 glioma model of different groups.
Abbreviations: RT-PCR, real-time polymerase chain reaction; mPEG-g-PEI, polyethylene glycol methyl ether grafted polyethylenimine; NC, negative control.