Figures & data
Figure 1 Characterization of PD-1-IRDye800CW. (A) Schematic representation of the PD-1-IRDye800CW fluorescent tracer. (B) UV-Vis-NIR absorbance spectra of the fluorescent tracers and free dye in PBS. (C) Fluorescence spectra of fluorescent tracers and free dye in water. (D) PD-1-IRDye800CW cell binding was monitored by FACS. (a–c) Untreated splenic cells were stained with isotype control IgG, unmodified PD-1, and PD-1-IRDye800CW. (d–f) Splenic cells treated with Con A were incubated with isotype control IgG, unmodified PD-1, and PD-1-IRDye800CW.
Abbreviations: Con A, concanavalin A; FACS, fluorescence-activated cell sorting; mAb, monoclonal antibody; UV-Vis-NIR, ultraviolet-visible-near-infrared.
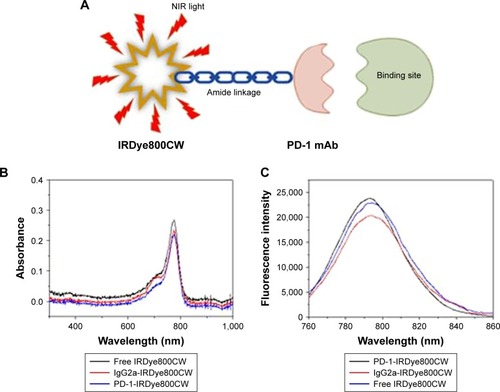
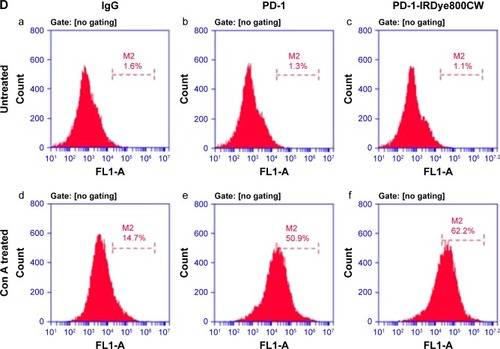
Figure 2 Analysis of PD-1-IRDye800CW biodistribution in 4T1-fLuc mammary tumor-bearing mice by FMI. (A) FMI of tumor-bearing mice injected with PD-1-IRDye800CW or IgG-IRDye800CW (n=3). BLI was used to denote the location of tumors. (B) Quantification of in vivo FMI TBR. (C) Ex vivo FMI of tumors and internal organs 8 hours after probe injection. The dotted circle indicates tumor location.
Abbreviations: 4T1-fLuc, firefly luciferase reporter gene expressing 4T1; BLI, bioluminescence imaging; FMI, fluorescence molecular imaging; TBR, tumor-to-background ratio.
Figure 3 FMI-guided surgery with PD-1-IRDye800CW and evaluation of tumor residuals (n=4). (A) White light and fluorescence images before and after tumor resection without (a–d) or with (e–h) FMI-guided surgery. (B) Tumor residuals were further evaluated by BLI before (a, c) and after surgery (b, d). Scale bar =50 µm. (C) Comparison of survival rate with or without FMI-guided surgery. *P<0.05.
Abbreviations: BLI, bioluminescence imaging; FMI, fluorescence molecular imaging.
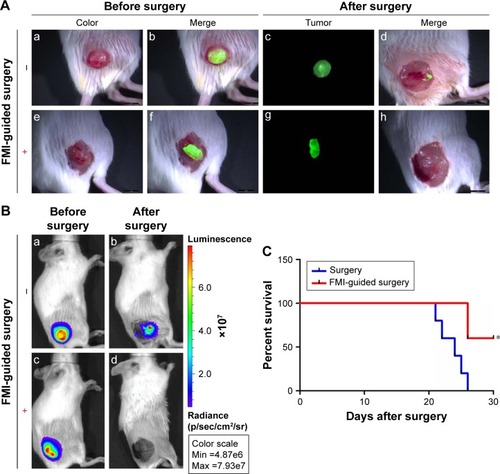
Figure 4 PD-1 immunotherapy combined with PD-1 image-guided surgery inhibited tumor relapse and increased overall survival. (A) Experimental schematic representation of the 4T1 tumor model. Body weight (B), survival (C), and metastasis (D) were monitored after surgery. **P<0.01.
Abbreviations: BLI, bioluminescence imaging; mAb, monoclonal antibody; PBS, phosphate buffered saline.
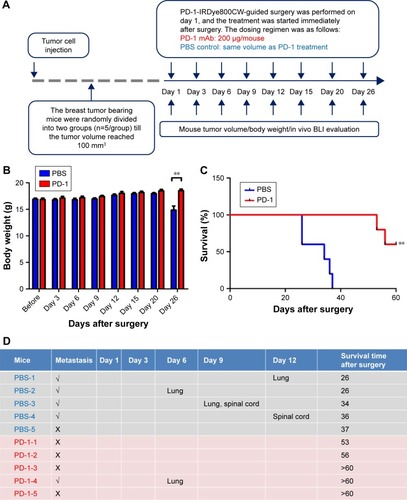
Figure 5 Serum IFN-γ (A) and IL-18 (B) levels of PD-1 mAb-treated mice and PBS controls were monitored by ELISA. **P<0.01.
Abbreviations: ELISA, enzyme-linked immunosorbent assay; IFN-γ, interferon-γ; mAb, monoclonal antibody; PBS, phosphate buffered saline.
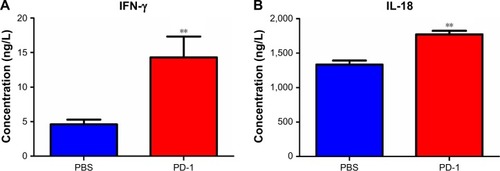
Figure S1 PD-1 and PD-L1 expression analysis in 4T1 mammary tumor tissues. (A) PD-1 and PD-L1 protein expressions were assessed in 4T1 mammary tumor homogenates. (B) Immunohistochemical analysis of PD-1 (a) and PD-L1 expression (c) in 4T1 mammary tumors. (b and d) IgG isotype staining served as a negative control for PD-1 and PD-L1. Scale bar =100 µm. (C) PD-1+ and PD-L1+ cell populations in TILs as determined by FACS (n=3).
Abbreviations: FACS, fluorescence-activated cell sorting; TILs, tumor-infiltrated lymphocytes.
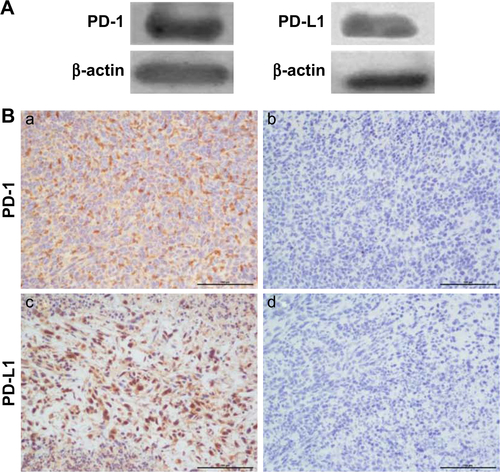
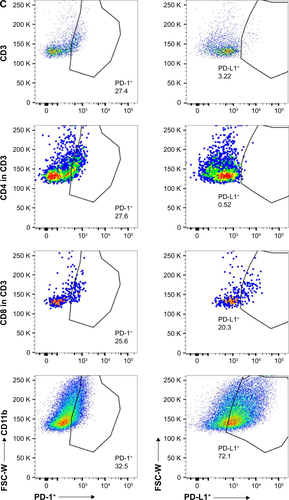
Figure S2 Photos of PD-1-IRDye800CW and IgG2a-IRDye800CW immunoconjugate dispersed in DMEM culture media containing 10% FBS, PBS, and SBF.
Abbreviations: FBS, fetal bovine serum; SBF, simulated body fluid; PBS, phosphate buffered saline.
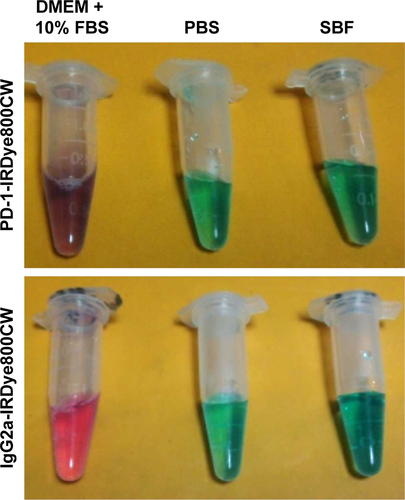
Figure S3 UV-Vis absorption spectra of PD-1-IRDye800CW and IgG2a-IRDye800CW immunoconjugate in DMEM culture media containing 10% FBS changed overtime. The solution was stored at 4°C for 7 days.
Abbreviations: FBS, fetal bovine serum; UV-Vis, ultraviolet–visible.
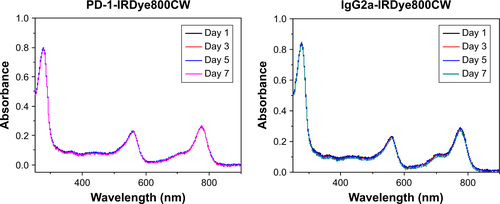
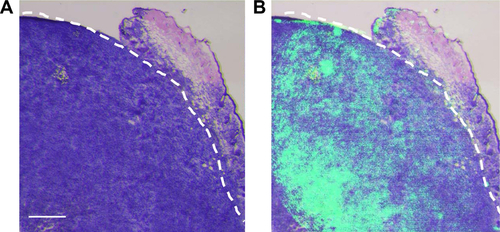
Figure S4 (A) Histological analysis of the tumor specimen encompassed the border regions between tumor and normal tissues from the resected tissues. (B) Overlay of PD-1 NIRF image and H&E staining of the specimen, showing consistent tumor margin at the microscopic level. Scale bar =500 µm.
Abbreviation: NIRF, near-infrared fluorescence.