Figures & data
Table 1 The groups of immunized mice
Figure 1 PCR product, SDS-PAGE and Western blotting of Omp31.
Notes: A PCR product of Omp31 gene (lanes 1–3) followed by agarose gel electrophoresis (A). Expression analysis of recombinant Escherichia coli. After induction with IPTG, the rOmp31 protein produced by recombinant cells was analyzed by SDS-PAGE (B). Lanes 1 and 2 show the induced and uninduced cell lysates of rOmp31 expressing E. coli cells, respectively. Western blot analysis of purified Omp31 with anti-His tag monoclonal antibody (C). 96 dpi (720*451).
Abbreviations: IPTG, isopropyl β-D-1-thiogalactopyranoside; PCR, polymerase chain reaction; Omp31, 31 kDa outer membrane protein; SDS-PAGE, sodium dodecyl sulfate polyacrylamide gel electrophoresis.
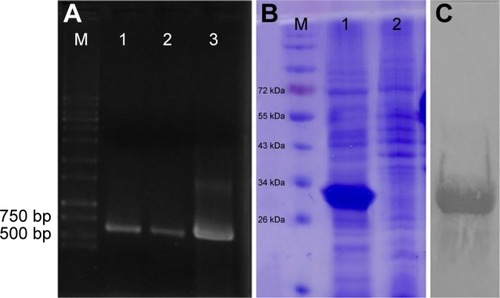
Figure 2 Appearance and size of the NPs were characterized by scanning electron micrograph of TMC/Omp31 nanoparticles.
Note: Scale bar represents 0.2 µm.
Abbreviations: NP, nanoparticle; TMC, N-trimethyl chitosan; Omp31, 31 kDa outer membrane protein.
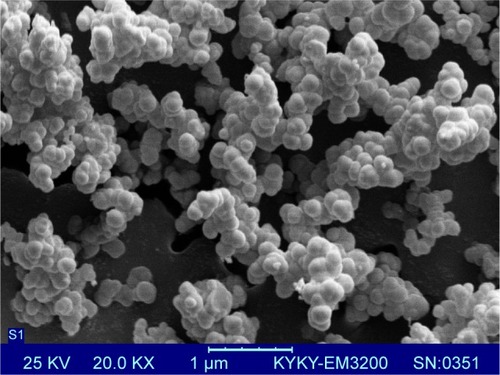
Figure 3 Release profile of TMC/Omp31 NPs at pH 7.4 for 10 days.
Abbreviations: TMC, N-trimethyl chitosan; Omp31, 31 kDa outer membrane protein; NP, nanoparticle.
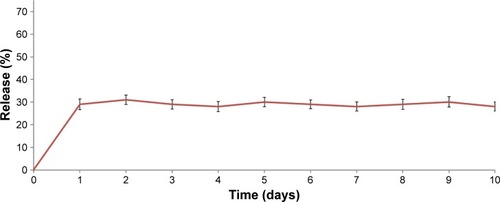
Figure 4 Anti-Omp31 antibody levels: the sera were analyzed in triplicates for Omp31-specific IgG antibodies by ELISA with comparison to the control group.
Notes: Sera obtained from mice belonging to different experimental groups were collected at regular intervals up to day 45 post-primary immunization, dilution 1:250 (A). Antibody level of intraperitoneally and orally immunized mice. Antibody isotyping (B and C): the isotype profiles of Omp31-specific antibodies in serum of orally and intraperitoneally immunized mice were analyzed by ELISA using HRP-conjugated anti-mouse IgG1 and IgG2a (dilution 1:8,000) antibodies. Omp31-specific mucosal IgA antibody levels in fecal samples from immunized mice, dilution 1:2 (D). Ratio of IgG2a/IgG1 (E), p#0.01. Immunization groups are based on .
Abbreviations: Omp31, 31 kDa outer membrane protein; ELISA, enzyme-linked immunosorbent assay; IFA, incomplete Freund’s adjuvant; PBS, phosphate buffered saline; NP, nanoparticle; ip, intraperitoneal; TMC, N-trimethyl chitosan; HRP, horseradish peroxidase.
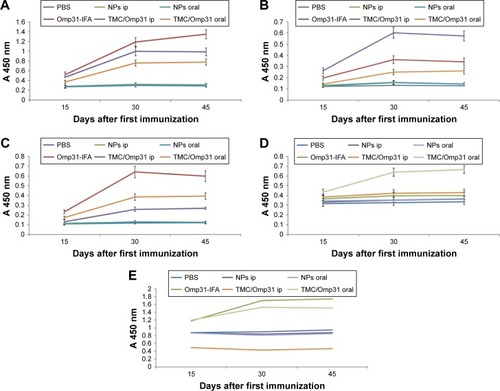
Figure 5 IL-4 (A), IFN-γ (B), IL-12 (C), and IL-17 (D) levels in cell supernatants were determined by ELISA.
Notes: Spleen cells (4×10⁶ mL−1 in duplicate wells) were stimulated with rOmp31 for 48 hours (p≤0.01). Immunization groups based on . *Significant difference between groups.
Abbreviations: IL, interleukin; ELISA, enzyme-linked immunosorbent assay; Omp31, 31 kDa outer membrane protein; IFA, incomplete Freund’s adjuvant; NP, nanoparticle; PBS, phosphate buffered saline; ip, intraperitoneal; TMC, N-trimethyl chitosan.
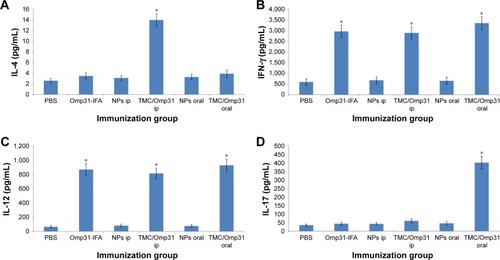
Table 2 Protection against Brucella melitensis 16M in BALB/c mice immunized with Omp31 compared with the vaccine strain Rev.1
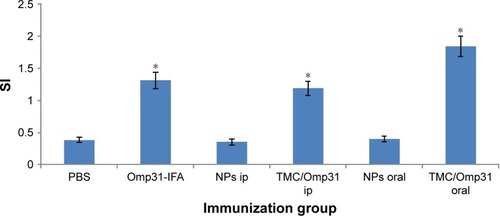
Figure 6 Lymphocyte proliferation assay of splenocytes from mice vaccinated with rOmp31.
Notes: Mice immunized with PBS and NPs were used as negative controls. Splenocytes from vaccinated mice (2×10⁵ cells/well) were stimulated with rOmp31 (0.1 µg/well) for 72 hours, and the proliferative response was determined by in vitro MTT assay. The SI corresponds to the count per minute of stimulated spleen cells divided by the count per minute of unstimulated spleen cells. The data are mean SI ± SD of five individual mice from each group with three repeats (p≤0.01). Immunization groups are based on . *Significant difference between groups.
Abbreviations: PBS, phosphate buffered saline; Omp31, 31 kDa outer membrane protein; NP, nanoparticle; SI, stimulation index; IFA, incomplete Freund’s adjuvant; ip, intraperitoneal; TMC, N-trimethyl chitosan.