Figures & data
Table 1 Characterization of paclitaxel hybrid nanomicelles
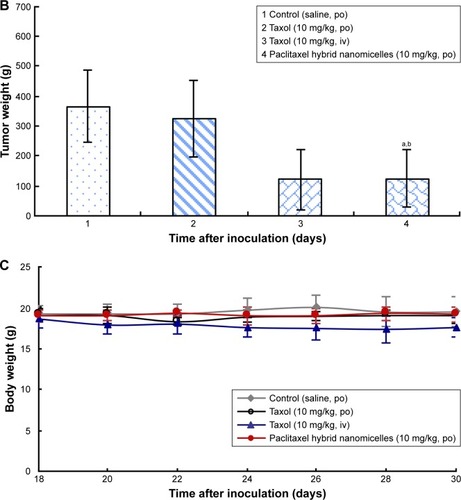
Figure 1 Characterization of paclitaxel hybrid nanomicelles.
Notes: (A) Schematic representations of paclitaxel nanomicelles (A1) and paclitaxel hybrid nanomicelles (A2). (B) Transmission electron microscopy image of paclitaxel hybrid nanomicelles, scale bar =50 nm. (C) Paclitaxel release rates (%) of paclitaxel solution, paclitaxel nanomicelles, and paclitaxel hybrid nanomicelles in simulated gastric fluid (pH 1.2, for 2 h) and simulated intestinal fluid (pH 7.4, until 48 h) at 37°C. Data are presented as mean ± SD (n=3).
Abbreviation: TPGS1000, d-α-tocopheryl polyethyleneglycol 1000 succinate.
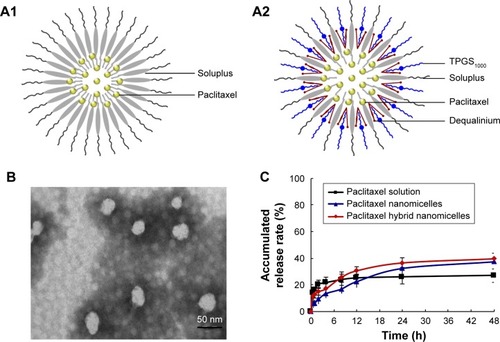
Figure 2 Intracellular uptake by MCF-7/Adr cells after treatment with various formulations.
Notes: (A) Laser scanning confocal fluorescence images of cells. Rhodamine 123 was used as a fluorescent indicator, while the nucleus was stained with Hoechst 333342. (B and C) Flow cytometry analysis of intracellular uptake by MCF-7/Adr cells: 1, control; 2, rhodamine 123; 3, rhodamine 123 nanomicelles; 4, rhodamine 123 hybrid nanomicelles. P<0.05; a, vs control; b, vs rhodamine 123; c, vs rhodamine 123 nanomicelles. Data are presented as mean ± SD (n=3).
Figure 3 Co-localization of paclitaxel hybrid nanomicelles with mitochondria in MCF-7/Adr cells. After treatment with various formulations for 4 h, co-localization was observed by laser scanning confocal microscopy. Coumarin was used as the fluorescent probe.
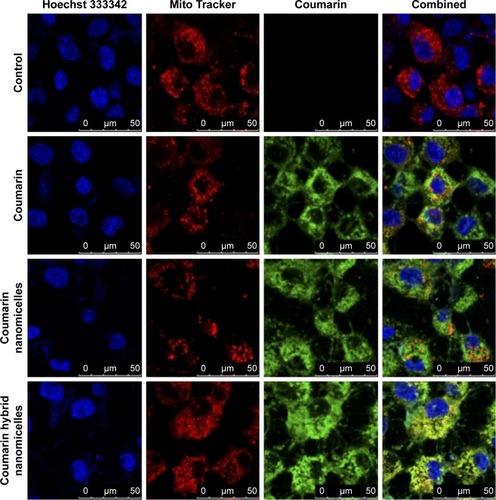
Figure 4 Survival rates of MCF-7 (A) or MCF-7/Adr (B) cells after treatment with various formulations. P<0.05; a, vs hybrid blank nanomicelles; b, vs paclitaxel solution; c, vs paclitaxel nanomicelles. Data are presented as mean ± SD (n=3).
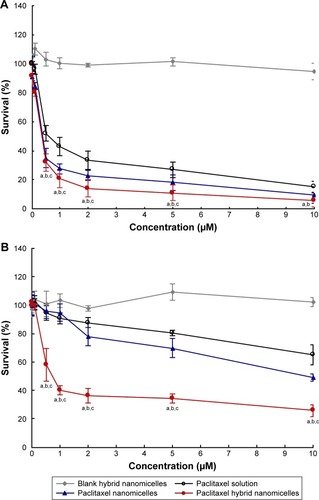
Figure 5 Induced apoptosis on MCF-7/Adr cells after treatment with various formulations.
Notes: (A,B) 1, control; 2, paclitaxel solution; 3, paclitaxel nanomicelles; 4, paclitaxel hybrid nanomicelles. P<0.05; a, vs control; b, vs paclitaxel solution; c, vs paclitaxel nanomicelles. Data are presented as mean ± SD (n=3).
Abbreviation: 7AAD, 7-Aminoactinomycin D.
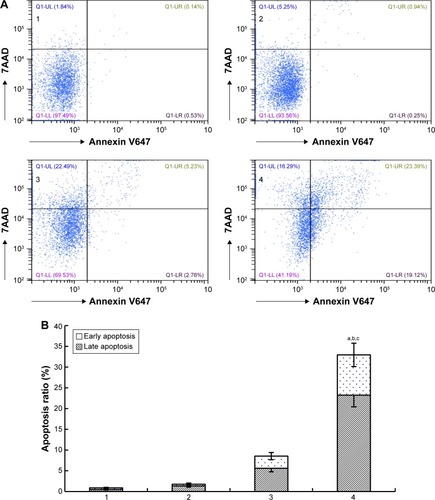
Figure 6 Activation of pro-apoptotic proteins and inhibition of anti-apoptotic proteins in MCF-7/Adr cells after treatment with various formulations.
Notes: (A–F) 1, control; 2, paclitaxel solution; 3, paclitaxel nanomicelles; 4, paclitaxel hybrid nanomicelles. P<0.05; a, vs control; b, vs paclitaxel solution; c, vs paclitaxel nanomicelles. Data are presented as mean ± SD (n=3).
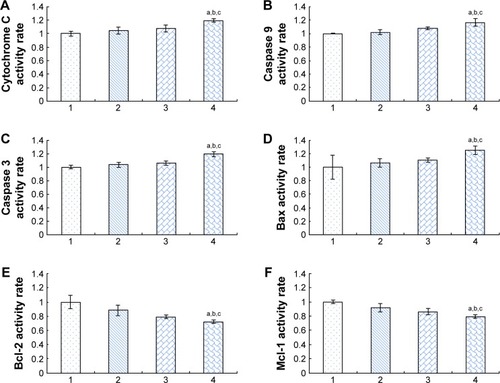
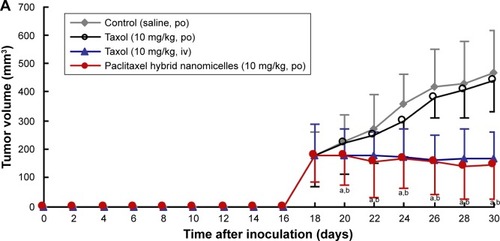
Figure 7 Antitumor efficacy by oral administration of paclitaxel hybrid nanomicelles in drug resistant breast cancer-bearing mice.
Notes: (A) Tumor volume changes in mice after administration; (B) tumor weight in mice after administration; (C) body weight changes of mice after administration. 1, control (saline, po); 2, taxol (po); 3, taxol (iv); 4, hybrid paclitaxel nanomicelles (po). P<0.05; a, vs control (saline, po); b, vs taxol (po). Data are presented as mean ± SD (n=6).
Abbreviations: po, orally; iv, intravenous.