
Figures & data
Table 1 Physicochemical characterization of PTX-loaded micelles (n=3)
Figure 1 Particle-size distribution and morphology of PTX-Ms and PTX-CMs.
Notes: Size distribution of PTX-Ms and PTX-CMs measured by DLS (A). TEM images of PTX-Ms (B) and PTX-CMs (C). Scale bar 200 nm. Plot of intensity ratios (I1:I3) as the function of micelle concentrations (D).
Abbreviations: PTX-Ms, paclitaxel-loaded monomethoxy(polyethylene glycol)-block-poly(d,l-lactide) micelles; CMs, sodium cholate and monomethoxy(polyethylene glycol)-block-poly(d,l-lactide) micelles; DLS, dynamic light scattering; TEM, transmission electron microscopy.
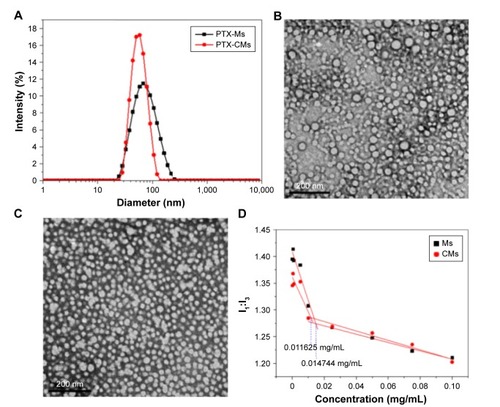
Figure 2 In vitro evaluation of micelles.
Notes: (A) In vitro PTX-release profiles of Taxol and PTX-loaded micelles in PBS solution (pH 7.4) with 0.2% Tween 80 at 37°C. Fluorescence-adsorption peaks of cells treated with FITC-Ms and FITC-CMs: (B) bone-marrow macrophages; (C) A549 cells. In vitro cytotoxicity of different formulations of PTX against human cancer cells: (D) BEL7402; (E) A549.
Abbreviations: PTX, paclitaxel; FITC-Ms, fluorescein isothiocyanate-loaded monomethoxy(polyethylene glycol)-block-poly(d,l-lactide) micelles; CMs, sodium cholate and monomethoxy(polyethylene glycol)-block-poly(d,l-lactide) micelles.
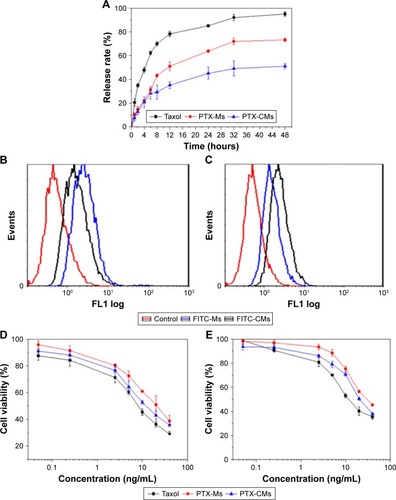
Table 2 IC50 of various PTX-loaded formulations against BEL7402 cells and A549 cells after 48 hours’ incubation
Table 3 Pharmacokinetic parameters of Taxol, PTX-Ms, and PTX-CMs after intravenous administration in Sprague Dawley rats at PTX dose of 8 mg/kg
Figure 3 Time courses of PTX levels in rat plasma after intravenous administration of PTX-Ms, PTX-CMs, and Taxol at PTX dose of 8 mg/kg (n=4).
Abbreviations: PTX-Ms, paclitaxel-loaded monomethoxy(polyethylene glycol)-block-poly(d,l-lactide) micelles; CMs, sodium cholate and monomethoxy(polyethylene glycol)-block-poly(d,l-lactide) micelles.
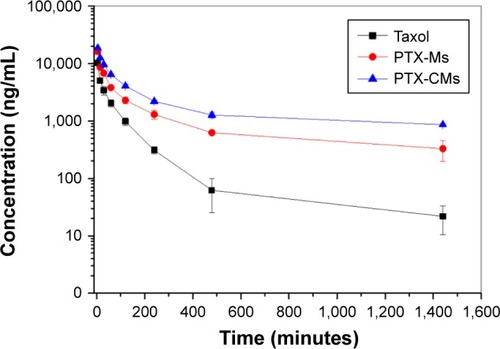
Figure 4 In vivo biodistribution of micelles in BEL7402 xenograft mice.
Notes: In vivo imaging of mice (A, B) and ex vivo imaging of tumors and major organs (C, D) at 2, 6, and 24 hours after mice had been treated with DiR-CMs (A, C) and DiR-Ms (B, D). (E) Tissue distribution of PTX at 2 hours after mice had been treated with Taxol, PTX-Ms, and PTX-CMs at PTX dose of 10 mg/kg.
Abbreviations: PTX-Ms, paclitaxel-loaded monomethoxy(polyethylene glycol)-block-poly(d,l-lactide) micelles; CMs, sodium cholate and monomethoxy(polyethylene glycol)-block-poly(d,l-lactide) micelles; DiR, 1,1′-dioctadecyl-3,3,3′,3′-tetramethylindotricarbocyanine iodide.
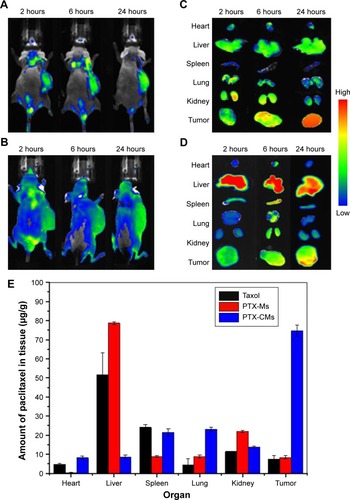
Figure 5 Antitumor activity of PTX-CMs in BEL7402 xenograft mice.
Notes: Tumor-growth curves of early-stage (A) and late-stage (C) tumor model. Body weight changes in early-stage (B) and late-stage (D) tumor model. Data are presented as mean ± SD (n=8). (E) Survival rates of mice in different treatment groups within 28 days. Data are presented as mean ± SD (n=8). (F) Representative images of mice treated with PTX-CMs at PTX dose of 30 mg/kg in late-stage tumor model at 0, 4, 8, 18, 25, and 32 days. Arrows indicate time when mice received intravenous injections.
Abbreviations: PTX-Ms, paclitaxel-loaded monomethoxy(polyethylene glycol)-block-poly(d,l-lactide) micelles; CMs, sodium cholate and monomethoxy(polyethylene glycol)-block-poly(d,l-lactide) micelles.
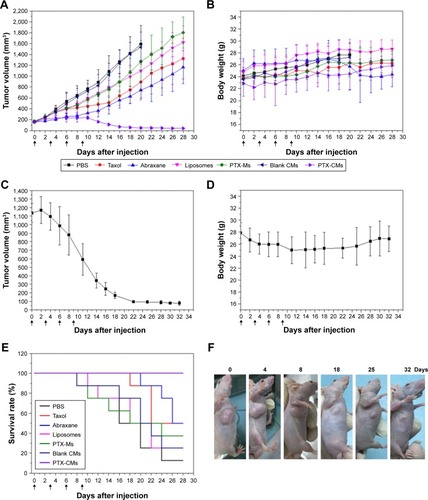
Figure 6 In vitro hemolysis of PTX-CMs.
Notes: Taxol (A); PTX-Ms (B); PTX-CMs (C). (D) Hemolysis percentage of Taxol, PTX-Ms, and PTX-CMs. Each data point is represented as mean ± SD (n=3). −, negative control; +, positive control.
Abbreviations: PTX-Ms, paclitaxel-loaded monomethoxy(polyethylene glycol)-block-poly(d,l-lactide) micelles; CMs, sodium cholate and monomethoxy(polyethylene glycol)-block-poly(d,l-lactide) micelles.
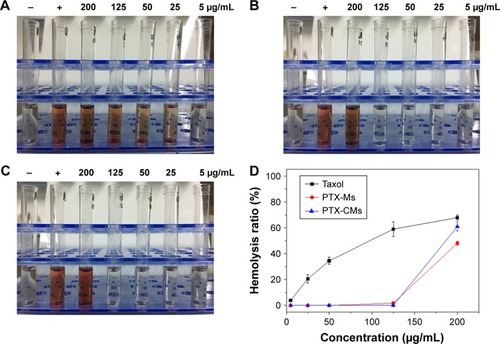
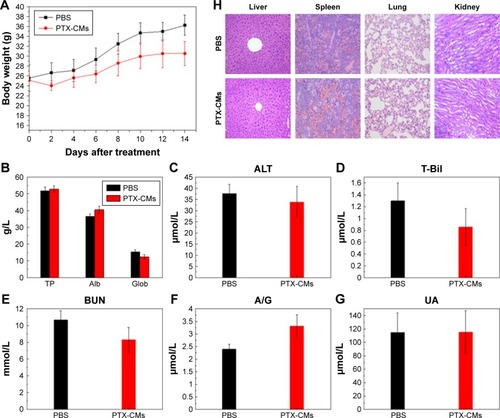
Figure 7 Systemic toxicity of PTX-CMs.
Notes: (A) Body weight changes after male ICR mice had received signal injections of PBS and PTX-CMs at PTX dose of 30 mg/kg. (B–G) Indicators of hepatic and renal functions in toxicity assay measured at 14 days posttreatment. Data are represented as mean ± SD (n=10). (H) H&E staining of major organs after single injection of PBS and PTX-CMs at PTX dose of 30 mg/kg. Magnification ×400.
Abbreviations: PTX-CMs, paclitaxel-loaded sodium cholate and monomethoxy(polyethylene glycol)-block-poly(d,l-lactide) micelles; TP, total protein; Alb, albumin; Glob, globulin; T-Bil, total bilirubin; BUN, blood urea nitrogen; A/G, Alb/Glob; UA, uric acid; ALT, alanine transaminase.
Scheme 1 Preparation of PTX-CMs and the fate of PTX-CMs in vivo.
Abbreviations: PTX, paclitaxel; mPEG, monomethoxy(polyethylene glycol); PLA, polylactic acid; CMs, sodium cholate and mPEG-block-poly(d,l-lactide) micelles; DiR, 1,1′-dioctadecyl-3,3,3′,3′-tetramethylindotricarbocyanine iodide; EPR, enhanced permeability and retention.
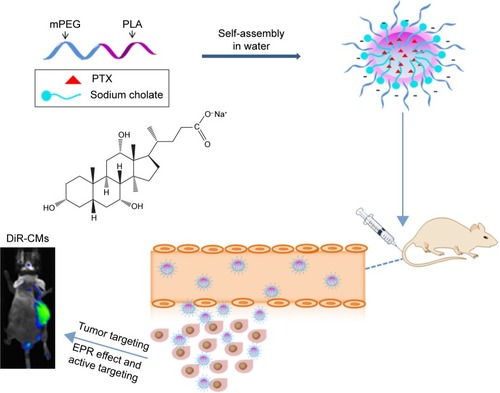
Figure S1 Cumulative PTX-release profile.
Notes: Four commercially available PTX formulations and PTX-CMs in PBS solution (pH 7.4) with 0.2% Tween 80 at 37°C. Data are shown as mean ± SD (n=3).
Abbreviations: PTX, paclitaxel; CMs, sodium cholate and monomethoxy(polyethylene glycol)-block-poly(d,l-lactide) micelles.
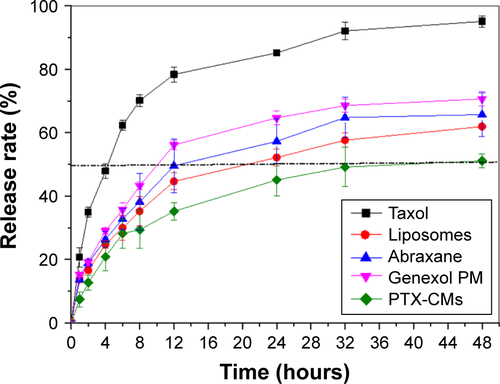
Figure S2 Fluorescence microscopy images of bone-marrow macrophage cells and A549 cells at 4 hours after incubation with FITC-Ms and FITC-CMs.
Abbreviations: FITC-Ms, fluorescein isothiocyanate-loaded monomethoxy(polyethylene glycol)-block-poly(d,l-lactide) micelles; CMs, sodium cholate and monomethoxy (polyethylene glycol)-block-poly(d,l-lactide) micelles.
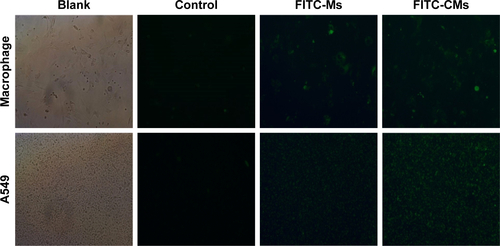
Figure S3 Quantitative flow-cytometry analysis of bone-marrow macrophage cells and A549 cells at 4 hours after incubation with FITC-Ms and FITC-CMs.
Abbreviations: FITC-Ms, fluorescein isothiocyanate-loaded monomethoxy(polyethylene glycol)-block-poly(d,l-lactide) micelles; CMs, sodium cholate and monomethoxy (polyethylene glycol)-block-poly(d,l-lactide) micelles.
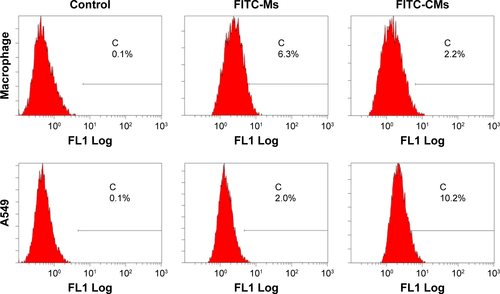
Figure S4 Antitumor effect of PTX-CMs in A549 late-stage tumor model.
Notes: (A) Tumor growth curve, and (B) body weight changes. Arrows indicate time points when mice received intravenous injections. Data are presented as mean ± SD (n=7).
Abbreviation: PTX-CMs, paclitaxel-loaded sodium cholate and monomethoxy(polyethylene glycol)-block-poly(d,l-lactide) micelles.
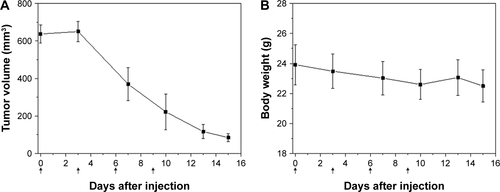
Table S1 Hematological test of whole blood collected from healthy ICR mice treated with single injections of PBS and PTX-CMs at PTX dose of 300 mg/kg (n=10)