Figures & data
Figure 1 Characterization of the high-performance Fe3O4@Ag MNPs.
Notes: TEM images of (A) Fe3O4, (B) Fe3O4@PEI-Au seed, and (C) Fe3O4@Ag MNPs. (D) Typical XRD patterns and (E) magnetic hysteresis curves of the prepared magnetic products.
Abbreviations: MNPs, magnetic nanoparticles; PEI, polyethyleneimine; TEM, transmission electron microscopy; XRD, X-ray diffraction.
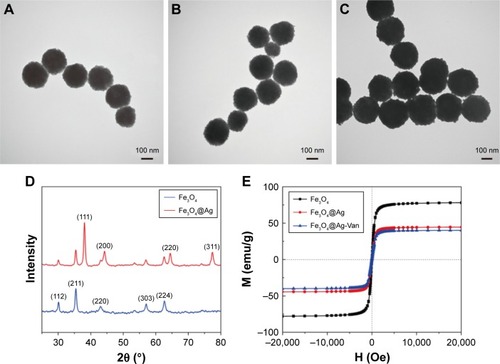
Figure 2 Characterization of the vancomycin-modified Fe3O4@Ag MNPs.
Notes: (A) Schematic of the molecular structure of vancomycin and its coupling interaction with Fe3O4@Ag MNPs. (B) The HRTEM image of Fe3O4@Ag-Van MNPs and (C) the corresponding magnified image obtained from the circled area in B. Arrows indicate a thin membrane-like layer of vancomycin and MUA. (D) The bright field TEM image of an individual Fe3O4@Ag-Van MNP. (E–G) The associated elemental mappings showing the element distributions of Fe (red), Ag (yellow), and N (pink) in the nanocomposite.
Abbreviations: HRTEM, high-resolution TEM; MNPs, magnetic nanoparticles; MUA, 11-mercaptoundecanoic acid; TEM, transmission electron microscopy; Van, vancomycin.
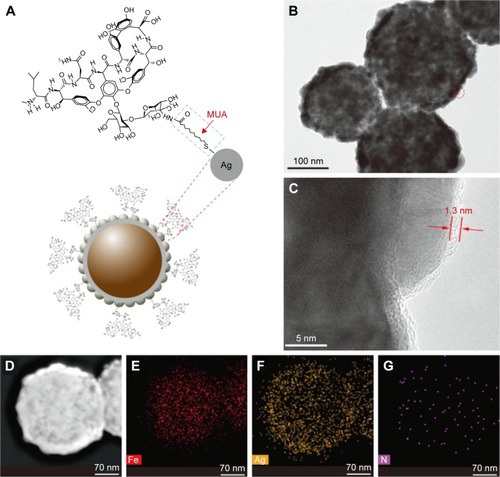
Figure 3 The bacteria capture ability of the Fe3O4@Ag-Van MNPs.
Notes: (A) Cartoon representation of the capture of bacteria by vancomycin-modified Fe3O4@Ag MNPs. The vancomycin-d-Ala-d-Ala interaction responsible for mediating the interaction between the Fe3O4@Ag-Van MNPs and the bacteria. (B) Phenomenon of Fe3O4@Ag-Van MNPs-mediated bacterial aggregation. Photo images of (a) Staphylococcus aureus solution, (b) solution with Fe3O4@Ag-Van MNPs added, (c) the mixture shaken for 15 min, and (d) solution after magnetic capture. (C) The TEM image of the phenomenon of bacterial aggregation in microscopic view. (D) The cell densities (OD600) of the supernatant corresponding to . (E) Captured kinetics of the Fe3O4@Ag-Van MNPs for S. aureus at a regular shaking incubation of 200 rpm. The original concentrations of the bacteria in PBS (10 mM, pH 7.4) exhibit an OD600 of 0.6. (F) The SERS spectra of S. aureus under different conditions: (a and b) S. aureus (108 cells/mL) captured by Fe3O4@Ag and Fe3O4@Ag-MUA, respectively, and (c, d) S. aureus 106 and 108 cells/mL captured by Fe3O4@Ag-Van MNPs, respectively.
Abbreviations: MNPs, magnetic nanoparticles; OD600, optical density at 600 nm; SERS, surface-enhanced Raman scattering; TEM, transmission electron microscopy; Van, vancomycin.
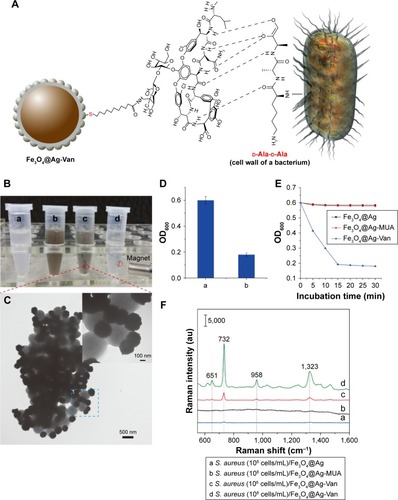
Figure 4 TEM images of the synthesized enhanced NPs.
Notes: (A) 45 nm Au NPs and (B) 60 nm Au@Ag NPs. The inset shows the HRTEM of Au@Ag NPs. (C) UV–visible spectra of the synthesized enhanced nanoparticles. The insets are the corresponding optical images. (D) Raman spectra of Staphylococcus aureus adsorbed on the two enhanced nanoparticles under the same conditions.
Abbreviations: HRTEM, high-resolution TEM; NPs, nanoparticles; TEM, transmission electron microscopy; UV, ultraviolet.
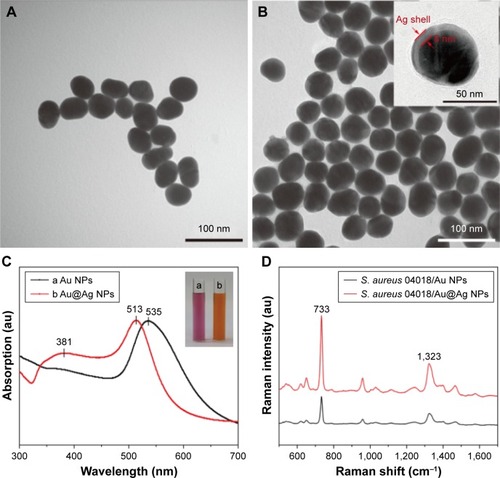
Figure 5 SEM images of the concentrated (A) Fe3O4@Ag-Van–Staphylococcus aureus complexes and (B) the complexes covered with Au@Ag NPs. (C) SERS spectra of different concentrations of S. aureus obtained with the combined use of Fe3O4@Ag-Van MNPs and Au@Ag NPs. (D) SERS spectra collected from 20 randomly selected spots on the Fe3O4@Ag-Van–S. aureus/Au@Ag NP complex substrate.
Abbreviations: MNPs, magnetic nanoparticles; NPs, nanoparticles; SERS, surface-enhanced Raman scattering; SEM, scanning electron microscopy; Van, vancomycin.
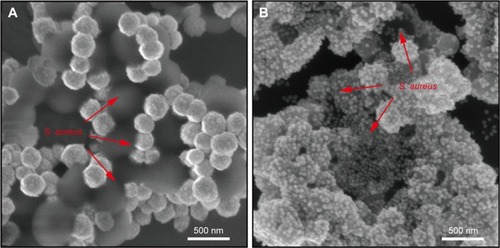
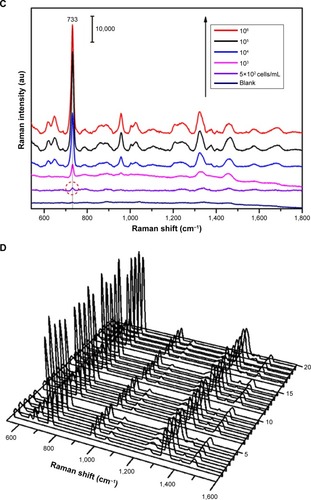
Figure 6 SEM images of the (A) concentrated Fe3O4@Ag-Van–Escherichia coli complexes, (B) Fe3O4@Ag-Van–E. coli complexes with additional Au@Ag NPs, (C) Fe3O4@Ag-Van–MRSA complexes, and (D) Fe3O4@Ag-Van–MRSA complexes with additional Au@Ag NPs. (E) Average Raman intensity of three bacteria strains (E. coli BL21, MRSA, and Staphylococcus aureus 04018). The shadowed area is standard deviation. Up to 15 different spectra collected from each bacterium are used to calculate the standard deviation. (F) The 2D–PCA plot showing the differentiation between E. coli BL21, MRSA, and S. aureus 04018.
Abbreviations: MRSA, methicillin-resistant S. aureus; NPs, nanoparticles; PCA, principal component analysis; SEM, scanning electron microscopy; Van, vancomycin.
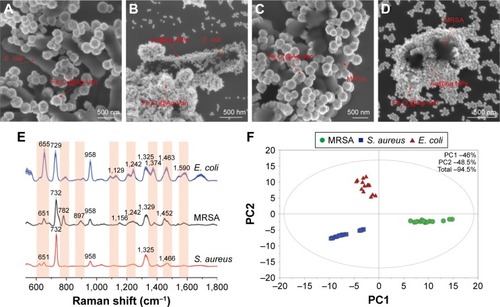
Table S1 Raman peaks of Staphylococcus aureus and corresponding assignments
Table 1 Characteristics of the combined SERS biosensor developed in this work compared to other recently reported label-free SERS strategies for bacteria detection
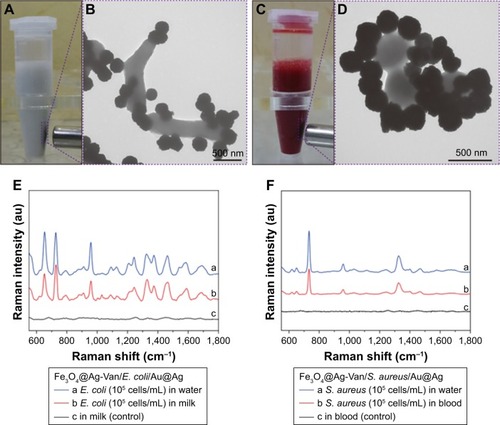
Figure 7 Photo images of Fe3O4@Ag-Van MNPs incubated with (A) milk sample containing Escherichia coli and (C) blood sample containing Staphylococcus aureus, and their corresponding TEM images of the captured (B) Fe3O4@Ag-Van–E. coli complexes and (D) Fe3O4@Ag-Van–S. aureus complexes. (E) SERS spectra of water and milk samples spiked with E. coli BL21 (105 cells/mL) and (F) SERS spectra of water and blood samples spiked with S. aureus 04018 (105 cells/mL) based on the combination of Fe3O4@Ag-Van MNPs and Au@Ag NPs. Milk and blood samples without bacteria were used as the control, respectively.
Abbreviations: MNPs, magnetic nanoparticles; NPs, nanoparticles; SERS, surface-enhanced Raman scattering; TEM, transmission electron microscopy; Van, vancomycin.
Scheme 1 Schematic illustration of the synthesis of vancomycin-modified Fe3O4@Ag MNPs and the operating procedure for rapid and label-free SERS detection of bacteria by using Fe3O4@Ag-van MNPs and Au@Ag NPs in combination.
Abbreviations: MNPs, magnetic nanoparticles; MUA, 11-mercaptoundecanoic acid; NPs, nanoparticles; SERS, surface-enhanced Raman scattering.
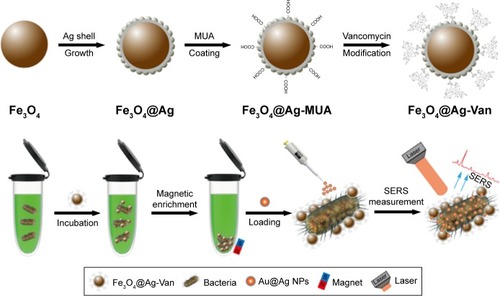
Figure S1 The detailed Fe3O4@Ag MNPs synthesis procedure.
Note: The insets show the magnetic separation behaviors of (a) Fe3O4, (b) Fe3O4@PEI-Au seed, and (c) Fe3O4@Ag MNPs in the solution.
Abbreviations: MNPs, magnetic nanoparticles; PEI, polyethyleneimine; PVP, polyvinylpyrrolidone.
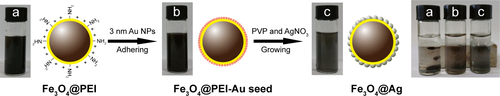
Figure S2 Raman spectra of 10−5 M PATP molecules absorbed on the Fe3O4@Ag MNPs (black), Fe3O4@Ag-Van MNPs (red), and 10−1 M PATP molecules absorbed on the Si substrate (blue).
Abbreviations: MNPs, magnetic nanoparticles; PATP, p-aminothiophenol; Van, vancomycin.
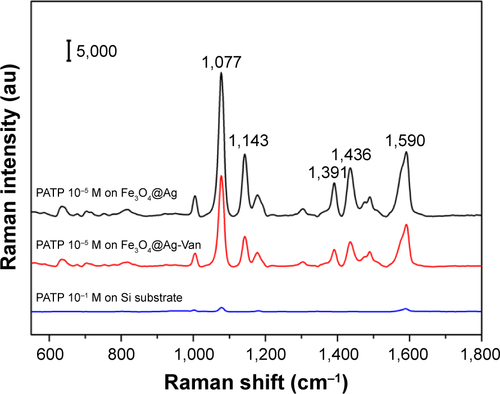
Figure S3 Zeta potentials of (A) Fe3O4@Ag, (B) Fe3O4@Ag-MUA, and (C) Fe3O4@Ag-Van in aqueous solution.
Abbreviations: MUA, 11-mercaptoundecanoic acid; Van, vancomycin.
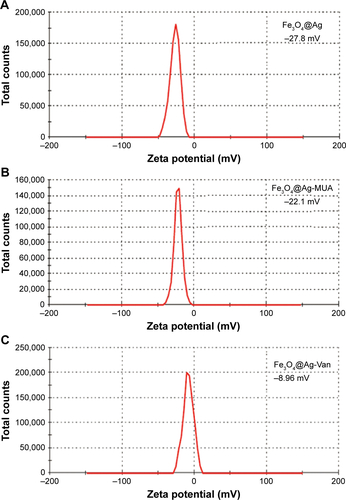
Figure S4 Absorption spectra of vancomycin solution before (a) and after (b) binding to Fe3O4@Ag-MUA MNPs.
Abbreviations: MNPs, magnetic nanoparticles; MUA, 11-mercaptoundecanoic acid.
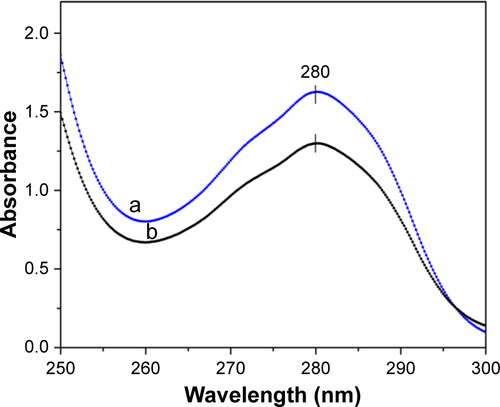
Figure S5 Effect of pH on the capture efficiency of Staphylococcus aureus; the original concentration of bacteria is 0.6 OD600 in PBS (10 mM).
Abbreviations: OD600, optical density at 600 nm; PBS, phosphate buffered saline.
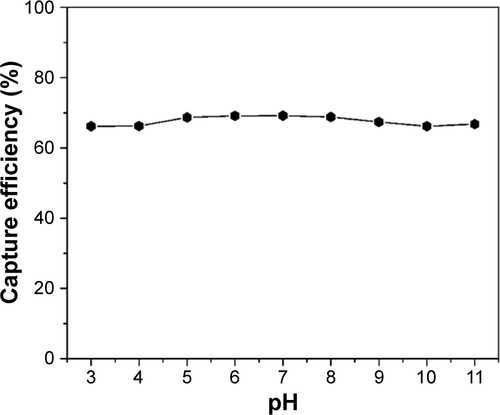
Figure S6 SERS spectra of different concentrations of Staphylococcus aureus 04018 obtained with the Fe3O4@Ag-Van MNPs as SERS substrates.
Abbreviations: MNPs, magnetic nanoparticles; SERS, surface-enhanced Raman scattering; Van, vancomycin.
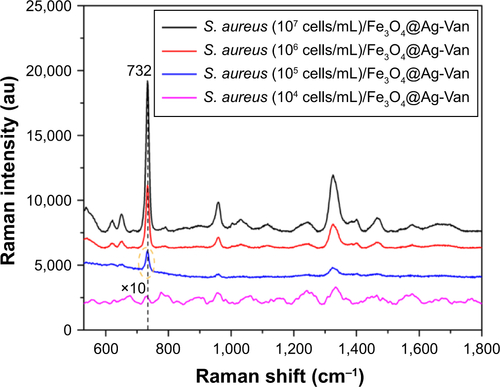
Figure S7 The intensity of SERS signals at 733 cm−1 as a function of the concentrations of the Staphylococcus aureus 04018 in PBS solution (10 mM, pH 7.4).
Abbreviation: SERS, surface-enhanced Raman scattering.
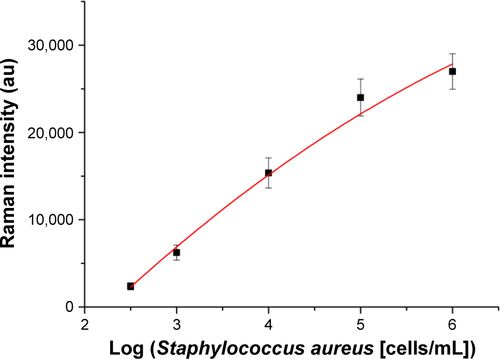
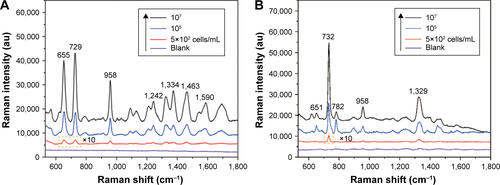
Figure S8 SERS spectra of different concentrations of (A) Escherichia coli BL21 and (B) MRSA obtained with the combining use of Fe3O4@Ag-Van MNPs and Au@Ag NPs.
Abbreviations: MNPs, magnetic nanoparticles; MRSA, methicillin-resistant Staphylococcus aureus; NPs, nanoparticles; SERS, surface-enhanced Raman scattering; Van, vancomycin.