Figures & data
Figure 1 Schematic illustration of the synthesis of the silver nanoparticles on montmorillonite suspension by γ-irradiation doses.
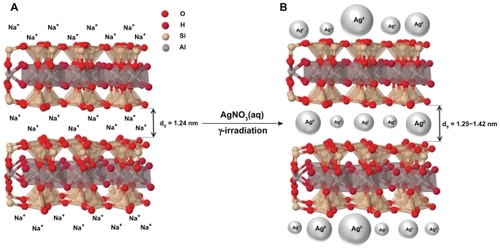
Figure 2 Photograph of AgNO3/MMT (A0) and Ag/MMT nanocomposite suspensions at different γ-irradiation doses: 1, 5, 10, 20, and 40 kGy (A1–A5).
Abbreviation: MMT, montmorillonite.
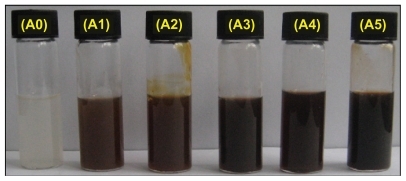
Figure 3 Powder X-ray diffraction patterns of montmorillonite (MMT) and Ag/MMT nanocomposites for 1, 5, 10, 20, and 40 kGy (A1–A5).
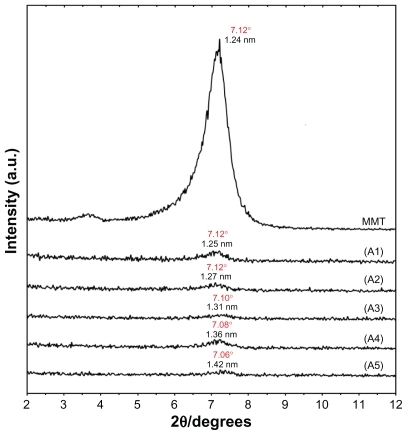
Figure 4 Powder X-ray diffraction patterns of montmorillonite (MMT) and Ag/MMT nanocomposites at the different γ-irradiation doses: 1, 5, 10, 20, and 40 kGy (A1–A5).
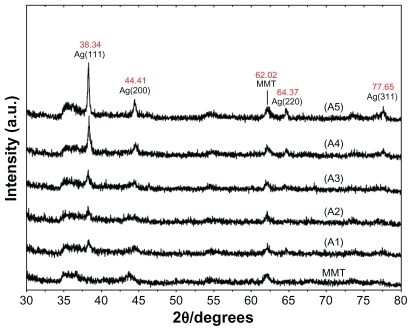
Figure 5 TEM images and their corresponding particle size distributions of Ag/MMT nanocomposites at the different γ-irradiation doses: 1 kGy (A, B), 5 kGy (C, D), 10 kGy (E, F), 20 kGy (G, H), and 40 kGy (I, J).
Abbreviations: MMT, montmorillonite; TEM, transmission electron microscopy.
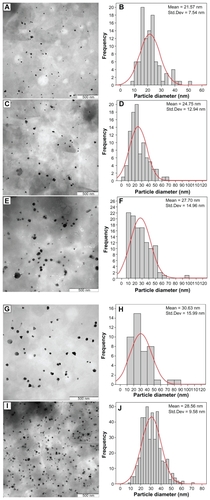
Figure 6 SEM micrographs and EDXRF spectra respectively for the MMT (A, B) and Ag/MMT nanocomposites: 1 kGy (C, D), 10 kGy (E, F), 20 kGy (G, H), and 40 kGy (I, J).
Abbreviations: EDXRF, energy dispersive X-ray fluorescence; MMT, montmorillonite; SEM, scanning electron microscopy.
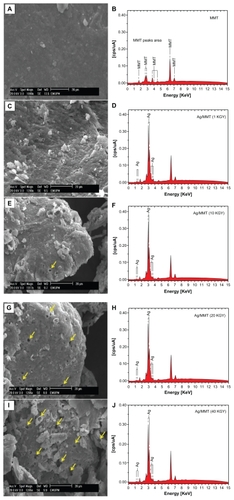
Figure 7 UV-visible absorption spectra for AgNO3/MMT (A0) and Ag/MMT nanocomposites suspension at the different γ-irradiation doses: 1, 5, 10, 20, and 40 kGy (A1–A5).
Abbreviations: MMT, montmorillonite; UV, ultraviolet.
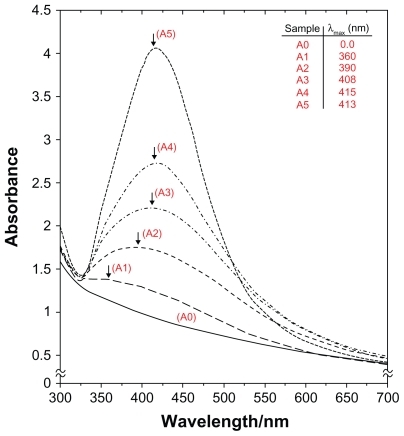
Figure 8 FT-IR spectra of montmorillonite (MMT), Ag/MMT nanocomposites at the different γ-irradiation doses: 1, 5, 10, 20, and 40 kGy (A1–A5).
Abbreviation: FT-IR Fourier transform infrared.
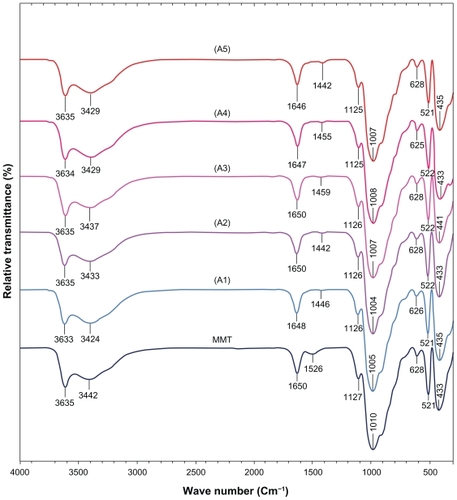
Table 1 Physical properties of Ag-NPs in Ag/MMT nanocomposites synthesized at different γ-irradiation doses in a constant concentration (0.2 mol/L) of AgNO3