Figures & data
Figure 1 Characterization of optical and physical properties of AgNps synthesized by chemical reduction method. (A) Absorbance spectra for AgNps in the UV–visible spectrum range between 380 and 420 nm with an absorbance maxima at 398 nm. (B) X-ray diffraction spectrum of AgNps in the range 30°–80° showing four peaks at 2θ values of 38.1°, 44.5°, 64.6°, and 77.5° corresponding to (111), (200), (220), and (311) planes, respectively. (C) TEM image showing spherical AgNps. (D) High-resolution TEM image for AgNps showing lattice spacing (d=0.23 nm, d represents the distance between two lattice fringes).
Abbreviations: Abs, Absorbance maximum; AgNps, silver nanoparticles; KX, magnification; TEM, transmission electron microscopy.
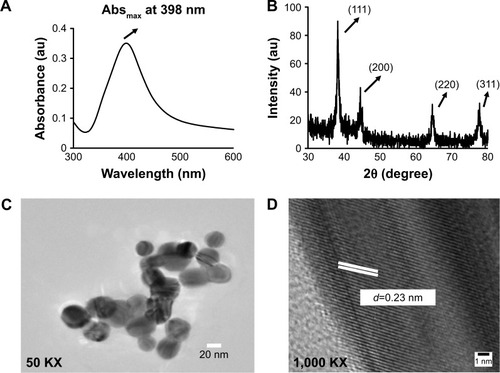
Figure 2 Characterization of physicochemical properties of AgNps. (A) SEM image for AgNps. (B) SEM/EDS spectrum for AgNps with a strong peak at 3 keV. (C) EDXRF spectrum of AgNps showing the elemental composition of the prominent peak. (D) Zeta potential for AgNps.
Abbreviations: AgNps, silver nanoparticles; cps, counts per second; EDS, energy dispersive X-ray spectroscopy; EDXRF, energy dispersive X-ray fluorescence; KX, magnification; SEM, scanning electron microscopy.
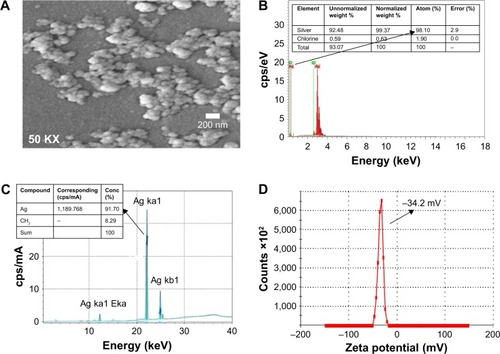
Figure 3 Antifungal activity of AgNps. (A) Determination of OD600 nm by broth microdilution method for Candida cells grown at 30°C in the absence (control) and presence of 5, 40, and 80 μg/mL AgNps, respectively. The values are mean ± SD of three independent sets of experiments. The * represents p<0.05 and *** represents p<0.001 with respect to control. (B) Dose-dependent percentage inhibition determined by broth microdilution method for Candida cells grown at 30°C in the presence of 5 μg/mL (♦), 40 μg/mL (■), and 80 μg/mL (▲) AgNp, respectively. (C) AgNp susceptibility profile determined by spot assay for Candida cells grown in the absence and presence of 5 and 40 μg/mL AgNp, respectively.
Abbreviations: AgNp, silver nanoparticle; OD, optical density.
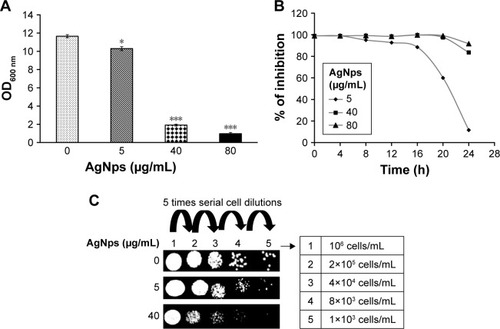
Figure 4 Intracellular ROS production in the Candida cells grown in the absence and presence of 5 μg/mL (subinhibitory) and 40 μg/mL (MIC90) AgNps estimated using the fluorescent dye DCFDA. (A) Quantitative measurement of endogenous ROS in AgNp-treated and untreated (control) Candida cells without addition of antioxidant and with addition of 5 mM antioxidant, AA. ROS levels are measured as Rf intensity and y-axis depicts the mean Rf values ± SD of three sets of independent experiments. Rf intensity was calculated by subtracting the Rf intensity for cells incubated without DCFDA (blank) from Rf intensity for cells incubated with DCFDA.Citation55 *** represents p<0.001 calculated with respect to “no AgNps” (control). (B) Confocal images showing green fluorescence for endogenous ROS in Candida cells grown in the absence (B, panel a) and presence of 5 and 40 μg/mL AgNps (B, panels c and d), respectively, without antioxidant (I, left two panels) and with 5 mM AA (II, right two panels). Each left panel of both I and II depicts the fluorescence intensity (higher fluorescence indicates higher ROS production) measured by a confocal microscope and each right panel of both I and II shows the merge for the phase-contrast micrographs and fluorescence images at magnification 100×. The obtained results were compared with untreated cells (no AgNps; B, panel a) and positive control (cells treated with 10 mM hydrogen peroxide, H2O2; B, panel b). (C) AgNp susceptibility profiling of Candida cells grown in the absence and presence of 5 mM AA using spot assay. AgNps were used at respective concentrations of 5 μg/mL (subinhibitory) and 40 μg/mL AgNp (MIC90).
Abbreviations: AA, ascorbic acid; AgNps, silver nanoparticles; DCFDA, 2,7,dichlorofluorescein diacetate; MIC, minimum inhibitory concentration; Rf, relative fluorescence; ROS, reactive oxygen species.
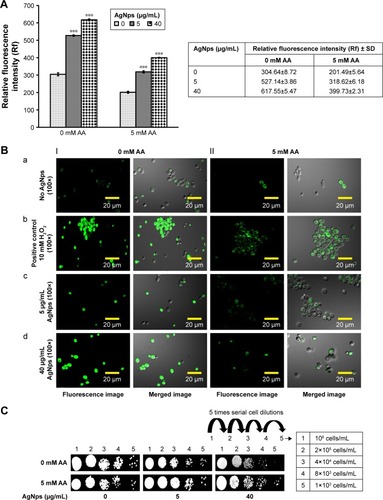
Figure 5 SEM micrographs (at 5 KX and 20 KX) for (A) untreated (no AgNps) Candida cells showing smooth surface of cell wall and (B) Candida cells treated with 40 μg/mL (MIC90) AgNps; the red arrows point at the rough outer cell wall after treatment with AgNps.
Abbreviations: AgNps, silver nanoparticles; KX, magnification; MIC, minimum inhibitory concentration; SEM, scanning electron microscopy.
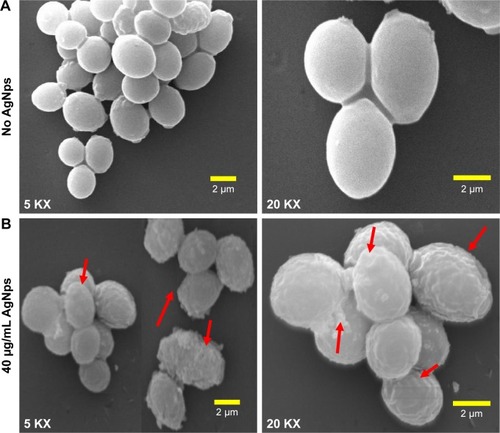
Figure 6 TEM images (at 6 KX and 25 KX) for Candida cells grown in the absence (no AgNps) and presence of AgNps. (A) Ultrastructure of cells grown without AgNps; cells without treatment revealed well-conserved ultrastructural features with a distinctive cell wall and cytoplasmic membrane and (B) cellular ultrastructure after treatment with 40 μg/mL (MIC90) AgNps; the red arrows indicate damage to the integrity of the cell wall and cytoplasmic membrane after treatment with AgNps.
Abbreviations: AgNps, silver nanoparticles; KX, magnification; MIC, minimum inhibitory concentration; TEM, transmission electron microscopy.
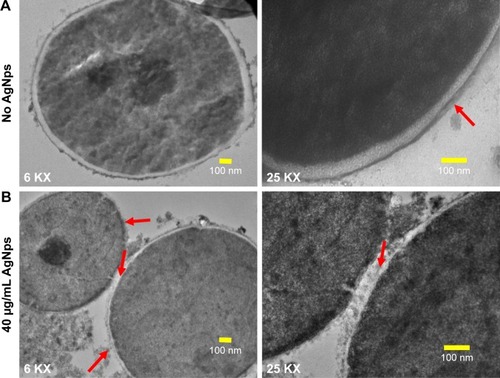
Table 1 Lifetime decay for DPH in nanoseconds in Candida cells grown in the absence (control) and presence of AgNps
Figure 7 Fluorescence polarization “p” values and fluorescence decay curves for the fluorophore, DPH in Candida cells grown in the absence and presence of 5 μg/mL (subinhibitory) and 40 μg/mL (MIC90) AgNps. (A) Mean fluorescence polarization “p” values (fluorescence values being inversely proportional to membrane fluidity) ± SD of three sets of experiments shown on the y-axis. *** represents test of significance p<0.001 calculated with respect to no AgNps (control). (B) Normalized lifetime decay curves for DPH showing time-dependent fluorescence decay intensity (with fits) in linear scale with respect to time in nanoseconds for cells grown in the absence (control indicated by blue curve) and presence of 5 μg/mL (shown by red curve) and 40 μg/mL (depicted by green curve) AgNps. The lifetime decay time for DPH in nanoseconds is given in .
Abbreviations: AgNps, silver nanoparticles; DPH, 1,6-diphenyl-1,3,5-hexatriene; MIC, minimum inhibitory concentration.
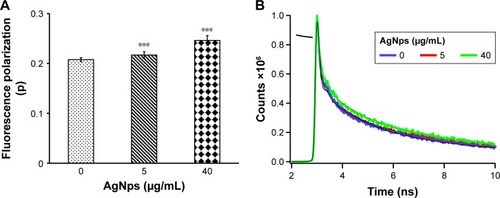
Figure 8 Ergosterol contents and UI for fatty acids of Candida cells grown in the absence (control) and presence of 5 μg/mL (subinhibitory) and 40 μg/mL (MIC90) AgNps. (A) Relative percentages of ergosterol contents in control and AgNp-treated cells calculated as mentioned in the “Material and methods” section; values on the y-axis are mean (the mean ergosterol content of cells is expressed as a percentage of the wet weight of the cells) ± SD of three independent sets of experiments. *** represents p<0.001 calculated with respect to no AgNps (control). (B) The degree of fatty acid unsaturation of the Candida cells grown in the absence (control) and presence of AgNps was calculated from the data in and expressed as UI as described in the “Materials and methods” section. UI for unsaturated fatty acids represent mean values ± SD of three independent sets of experiments. ** represents p<0.01 and *** represents p<0.001, respectively, calculated with respect to no AgNps (control).
Abbreviations: AgNps, silver nanoparticles; MIC, minimum inhibitory concentration; SD, standard deviation; UI, unsaturation indices.
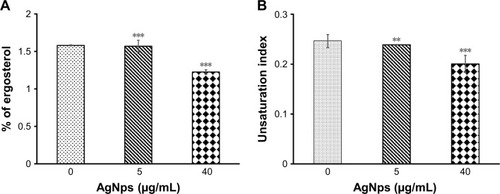
Table 2 Relative percentages of fatty acids and values for UI in Candida cells (grown in the absence and presence of AgNps)
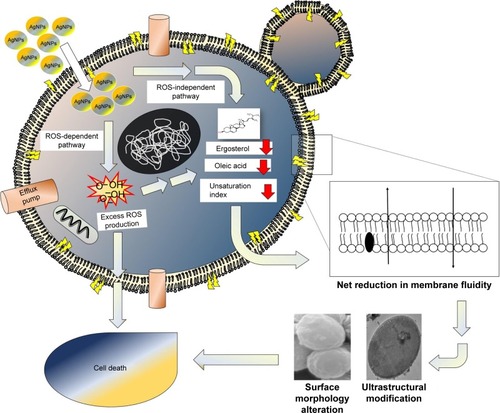
Figure 9 Schematic representation for the proposed model for mechanism of action of AgNps against Candida cells, depicting possible cellular targets and existence of ROS-dependent and ROS-independent pathways for fungicidal action of AgNps.
Abbreviations: AgNps, silver nanoparticles; ROS, reactive oxygen species.