Figures & data
Table 1 Median particle size and potential of free, and ANS-loaded nanoparticles
Figure 1 TEM micrograph of PEG-PLA ANS-NPs.
Notes: Images show polydispersed monosize ANS-NP. (A) 4,000×, (B) 6,000×, (C) 30,000×, (D) close image at 50,000× of single ANS-NP showing the diameter.
Abbreviations: TEM, transmission electron microscopy; ANS, anastrozole; NPs, nanoparticles.
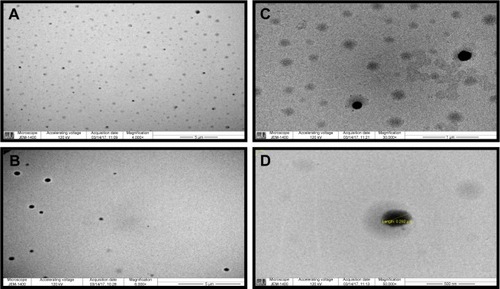
Figure 2 SEM micrograph of PEG-PLA ANS-NPs showing the NPs in the aggregate form.
Abbreviations: SEM, scanning electron microscopy; ANS, anastrozole; NPs, nanoparticles.
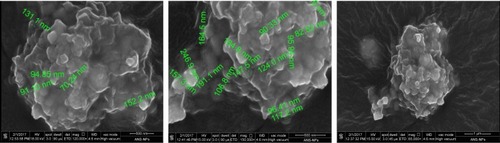
Figure 3 Cumulative drug release of ANS-loaded PLA-PEG-PLA NPs over a period of 144 hours.
Note: Error bars represent standard error of the mean for three different batches.
Abbreviations: ANS, anastrozole; NPs, nanoparticles.
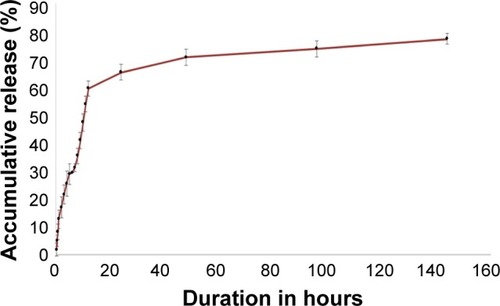
Figure 4 Cytotoxicity of ANS-NPs toward MCF-7 cells after incubation for 72 hours (n=3).
Notes: Results show a proximal toxic behavior between the ANS and ANS-NP with no obvious effect of the increased concentration of the treatments. Moreover, the void NPs show no toxicity (<10%) toward the cells even with increased concentration used for the NPs. Error bars represent standard error of the mean (n=3).
Abbreviations: ANS, anastrozole; NP, nanoparticle.
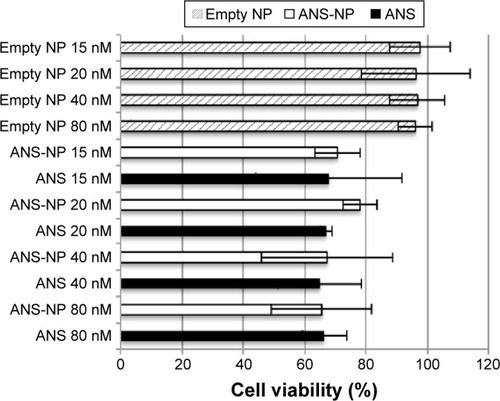
Figure 5 Representative photos show MCF-7 cells after incubation for 72 hours (magnification power 20×).
Notes: (A) Control of untreated cells. (B–D) Represent cells treated with 15, 40, 80 nM of empty NPs respectively. (E, G, I, K) Show cells treated with 15, 20, 40, 80 nM of free ANS respectively, while (F, H, J, L) demonstrate photos of cells treated with 15, 20, 40, 80 nM of ANS-NPs respectively.
Abbreviations: ANS, anastrozole; NPs, nanoparticles.
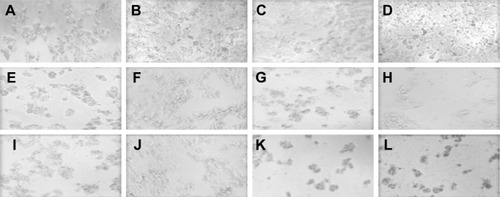
Figure 6 Light and fluorescence microscopy images of quantum dot (QD) labeled InP:ZnS QD-NPs in the MCF-7 cells.
Notes: (A) Untreated control cells. (B–D) 20× images of the cells after incubation with InP:ZnS QD-NPs for 4 hours. (E, F) Higher magnification of treated cells 40×.
Abbreviation: NPs, nanoparticles.
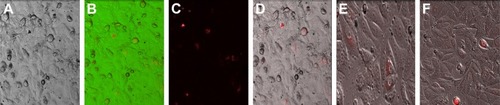
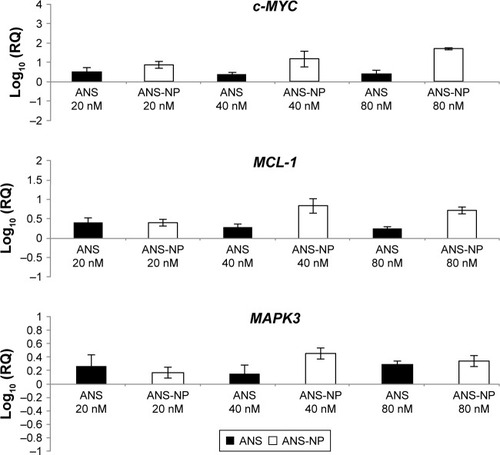
Figure 7 Gene expression of c-MYC, MAPK3, and MCL-1 in MCF-7 cell lines treated with ANS and ANS-NPs for 96 hours.
Notes: The results showed upregulation of all the genes as response to ANS and ANS-NP treatments. Error bars represent standard error of the mean (n=3).
Abbreviations: ANS, anastrozole; NP, nanoparticle.