
Figures & data
Figure 1 Effects of TiO2 NPs on net increase in BW and ovarian weight after gavage administration for 30 days.
Notes: Different letters within the same parameter indicate significant differences between groups (p < 0.05). Values represent mean ± SD (n = 10).
Abbreviations: BW, body weight; TiO2 NPs, titanium dioxide nanoparticles.
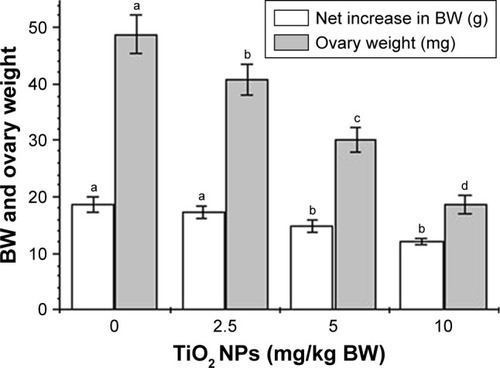
Figure 2 Effect of TiO2 NPs on conception in female mice after gavage administration for 30 days.
Notes: Different letters within the same parameter indicate significant differences between groups (p < 0.05). Values represent mean ± SD (n = 10).
Abbreviations: BW, body weight; TiO2 NPs, titanium dioxide nanoparticles.
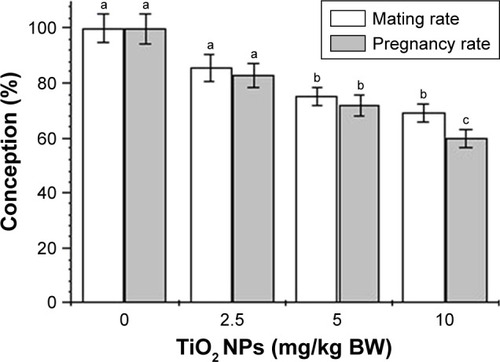
Figure 3 Histopathological examination of ovary of mice following gavage administration of TiO2 NPs for 30 days.
Notes: (A) Control groups (unexposed mice) present normal development of primary follicles (black arrow) and secondary follicles (yellow arrow); (B) the 2.5 mg/kg TiO2 NP-exposed group shows atrophic secondary follicle (yellow arrow), primary follicle atresia (green arrow) and apoptosis of granule cells (blue arrow); (C) the 5 mg/kg TiO2 NP-exposed group shows large primary follicle atresia (green arrow) and granule cell apoptosis (blue arrow), and (D) the 10 mg/kg TiO2 NP-exposed group shows severe inflammatory cell infiltration (green circle), congestion (yellow circle), significant primary follicle atresia (green arrow) and disposed disorder or apoptosis of granule cells (blue arrow).
Abbreviation: TiO2 NPs, titanium dioxide nanoparticles.
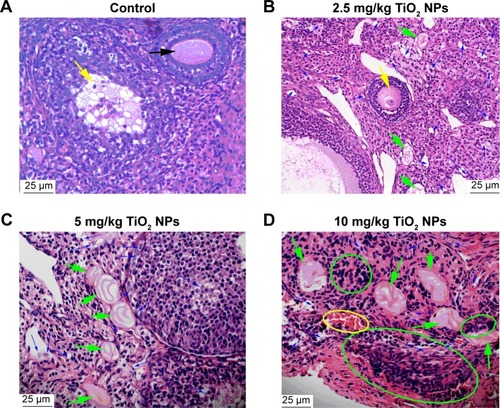
Table 1 Changes in serum parameters involved in autoimmune response in female mice caused by gavage administration of TiO2 NPs for 30 days