Figures & data
Table 1 Synergy based on the nonlinear dose–effect curves
Figure 1 DLS and ZP.
Notes: (A) Hydrodynamic diameters of the synthesized SeNPs stabilized in bovine serum albumin and dispersed in DI water; the average size of the nanoparticles is 96.3 nm. (B) The ZP showed a negative charge of −35.7 mV.
Abbreviations: DI, deionized; DLS, dynamic light scattering; SeNPs, selenium nanoparticles; ZP, zeta potential.
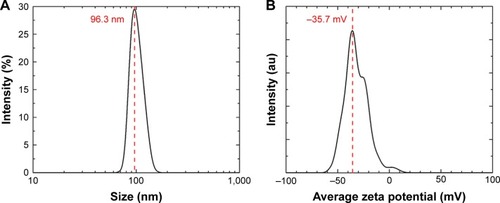
Figure 2 EDS spectrum of SeNPs.
Notes: Se EDS peaks are labeled. Strong signals from the atoms in the SeNPs observed in the spectrum confirm Se metalloid nanoparticles on the yeast outer CW by spectral mapping acquisition.
Abbreviations: CW, cell wall; EDS, energy-dispersive spectroscopy; Se, selenium; SeNPs, selenium nanoparticles; UTSA, University of Texas at San Antonio.
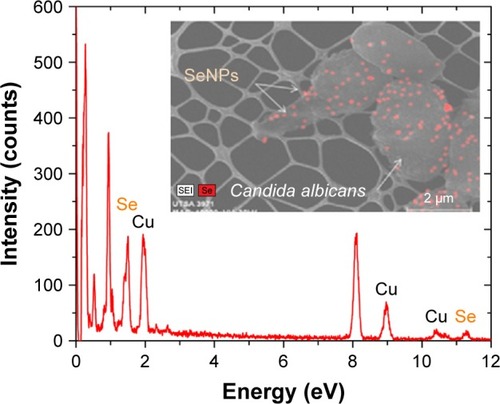
Figure 3 Dose–response curves.
Notes: (A) Dose–response curves for the activity of SeNPs, CS, and CS-SeNPs against preformed C. albicans biofilms. The half maximal inhibitory concentration (IC50) values were calculated as SeNPs (21.7 ppm) and CS-SeNPs (3.52 ppm). Values are the mean ± SEM (error bars) from independent experiments performed in duplicate. (B) Cytotoxicity of CS-SeNPs in RPE-19 cells, the 50% cytotoxic concentration (CC50) is 26.3 ppm. Cytotoxicity of CS-SeNPs was quantified by a Luciferase assay after 24 h of compound incubation. X-axis, concentration in ppm; Y-axis, percentage of cell cytotoxicity. Dose–response curves were plotted using Origin 9 curve fit. Each data point represents the mean ± SEM of three independent experiments performed on different days. (C) The CI was determined. A horizontal red line marks CI=1. The data are the mean values from three independent experiments. Combined doses of CS and SeNPs from 160–1.6 to 25,000–25 ppm, respectively, resulted in Fa from 0.6 to 0.9 with a CI<1 (synergy). Doses under 3.5–35 ppm of CS-SeNPs, respectively, were antagonistic.
Abbreviations: C. albicans, Candida albicans; CI, combination index; CS, chitosan; CS-SeNPs, CS-decorated SeNPs; Fa, fraction affected; SEM, standard error of the mean; SeNPs, selenium nanoparticles.
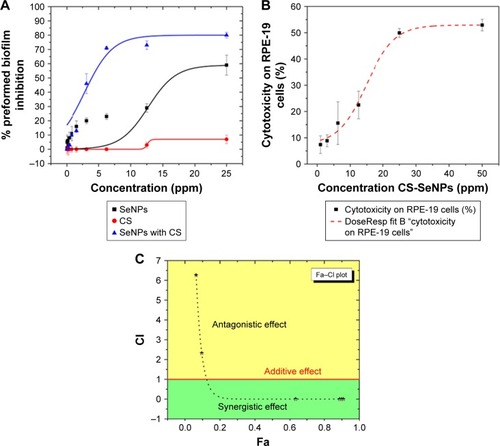
Figure 4 SEM.
Notes: (A) Untreated C. albicans biofilms show a characteristic ovoid morphology, and a dense network of yeast cells and hyphae (B) biofilms treated with CS at 25,000 ppm showed enlarged and deformed yeast cell, (C) C. albicans treated with SeNPs at 21.7 ppm shows changes in morphology (red arrows) and (D) C. albicans treated with CS-SeNPs at 3.5 ppm has major changes in morphology and structure (red arrows), the polymer adheres to the CW. (E) BF STEM image of a C. albicans biofilm treated with CS-SeNPs. Throughout the CW, nanoparticles can be observed entering and the CS biopolymer containing SeNPs adheres to the outer CW. CS-SeNPs, CS-decorated SeNPs.
Abbreviations: BF, bright-field; C. albicans, Candida albicans; CS, chitosan; CW, cell wall; SEM, scanning electron microscopy; SeNPs, selenium nanoparticles; STEM, scanning transmission electron microscopy; UTSA, University of Texas at San Antonio.
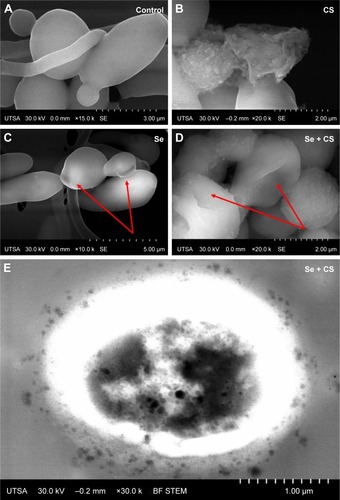
Figure 5 TEM.
Notes: (A) Ultrastructure of untreated C. albicans yeast cell after thin sectioning shows a characteristic ovoid morphology. (B and C) After 24 h treatment with CS-SeNPs (3.5 ppm), the yeast cell loses the characteristic morphology as the cell distorts, the CW disrupts, and the CS-SeNPs enter the cell. CS-SeNPs, CS-decorated SeNPs.
Abbreviations: C. albicans, Candida albicans; CS, chitosan; CW, cell wall; SeNPs, selenium nanoparticles; TEM, transmission electron microscopy.
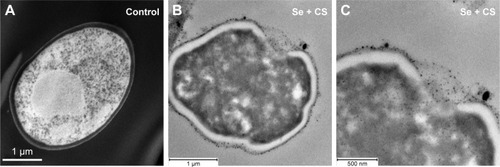
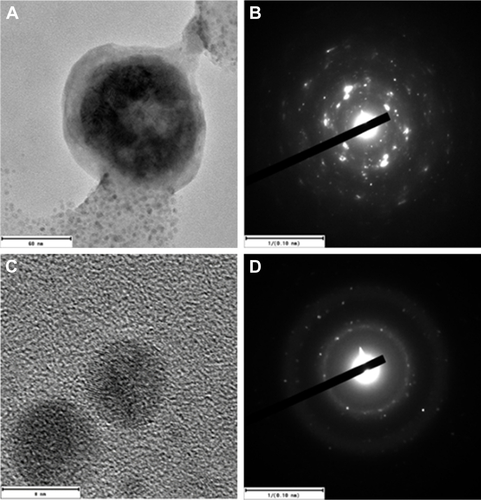
Figure S1 HRTEM images of the CS-SeNPs.
Notes: Electron diffraction pattern of (A and B) large and (C and D) small nanoparticles indicates that both are crystalline in nature. CS-SeNPs, CS-decorated SeNPs.
Abbreviations: CS, chitosan; HRTEM, high-resolution transmission electron microscope; SeNPs, selenium nanoparticles.