Figures & data
Figure 1 The synthesis routes of TMC and Mal-TMC.
Note: R represents the maleimide group.
Abbreviations: TMC, N-trimethylated chitosan; Mal-TMC, maleimide–TMC; SMP, N-Succinimidyl 3-maleimidopropionate.
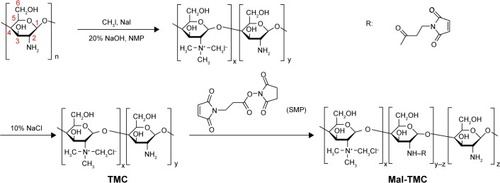
Table 1 Different levels of variables in the Box–Behnken design
Figure 2 1H-NMR spectra of (A) chitosan, (B) TMC, and (C) Mal-TMC.
Abbreviations: NMR, nuclear magnetic resonance; TMC, N-trimethylated chitosan; Mal-TMC, maleimide–TMC.
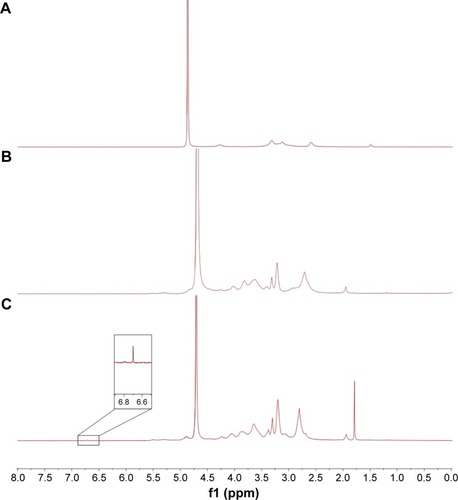
Table 2 Effect of independent variables on dependent variables
Figure 3 3D response surface plots showing the effect of independent variables on dependent variables. The y-axis represents the desirability of dependent variables. The sign represents the site of the optimal formulation.
Abbreviation: PVA, polyvinyl alcohol.
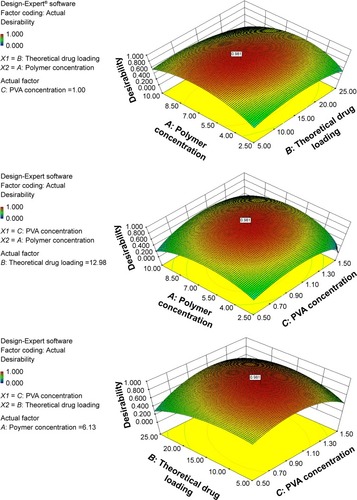
Table 3 Characterization of Huperzine A-loaded nanoparticles
Figure 4 In vitro release study of HupA from free Huperzine A, HupA PLGA NPs, HupA TMC NPs and HupA Lf-TMC NPs in 0.1 M pH 7.4 PBS.
Abbreviations: HupA, Huperzine A; PLGA, polylactide-co-glycoside; Lf, lactoferrin; TMC, N-trimethylated chitosan; NPs, nanoparticles; PBS, phosphate buffered saline.
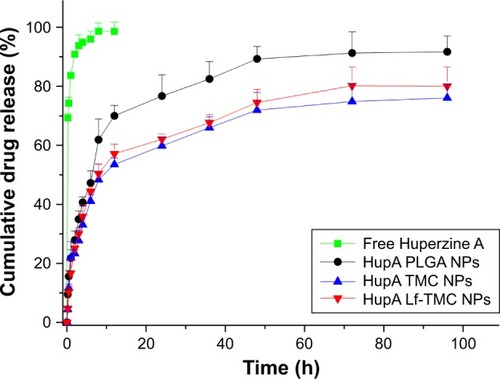
Figure 5 Binding efficiency of mucin to NPs. Values represent the mean ± SD (n=3). Statistically significant differences with PLGA NPs are marked with (**) for p<0.01.
Abbreviations: PLGA, polylactide-co-glycoside; Lf, lactoferrin; TMC, N-trimethylated chitosan; NPs, nanoparticles.
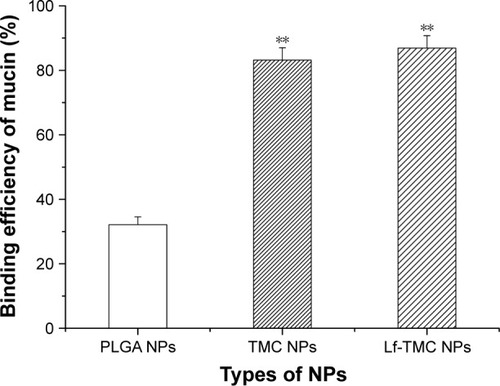
Figure 6 Cytotoxicity of free HupA, HupA loaded (A) and unloaded NPs (B) incubated for 24 h in 16HBE cells. Values represent the mean ± SD (n=3). Statistically significant differences with PLGA NPs are marked with * for p<0.05 and ** for p<0.01.
Abbreviations: HupA, Huperzine A; PLGA, polylactide-co-glycoside; Lf, lactoferrin; TMC, N-trimethylated chitosan; NPs, nanoparticles.
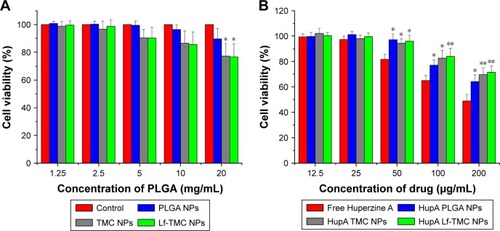
Figure 7 Cellular uptake of NPs. Fluorescence microscopy images of cellular uptake of Nile red NPs in 16HBE (A) and SH-SY5Y cells (B); original magnification ×200. Mean fluorescence intensity on flow cytometry of coumarin-6 NPs in (C) 16HBE and (D) SH-SY5Y cells. Values represent the mean ± SD (n=3). Statistically significant differences with PLGA NPs are marked with ** for p<0.01. Statistically significant differences with TMC NPs are marked with # for p<0.05 and ## for p<0.01.
Abbreviations: PLGA, polylactide-co-glycoside; Lf, lactoferrin; TMC, N-trimethylated chitosan; NPs, nanoparticles.
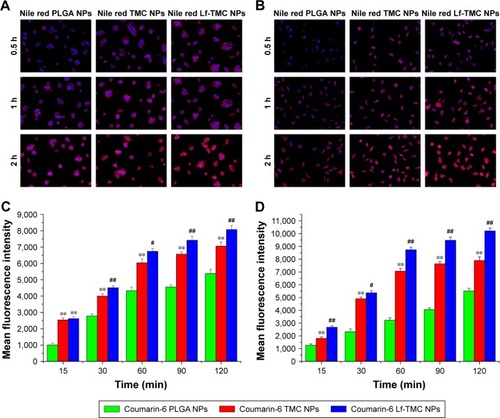
Figure 8 In vivo and ex vivo fluorescence images of organs of mice. (A) In vivo imaging of mice at 0.5, 1, 4, and 8 h after intranasal administration of DiR-loaded PLGA NPs, TMC NPs, and Lf-TMC NPs at a dose of 0.5 mg DiR/kg of body weight. (B) Ex vivo imaging of organs excised from mice at 8 h after intranasal administration.
Abbreviations: DiR, 1,1-dioctadecyl-3,3,3,3-tetramethylindotricarbocyanineiodid; PLGA, polylactide-co-glycoside; Lf, lactoferrin; TMC, N-trimethylated chitosan; NPs, nanoparticles.
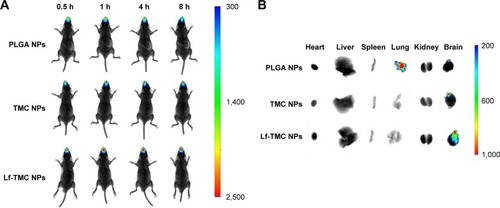
Table 4 Pharmacokinetic parameters following intranasal administration of Huperzine A-loaded nanoparticles
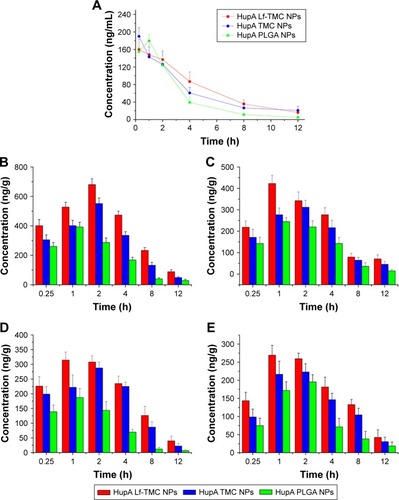
Figure 9 Brain distribution of Hup ANPs. (A) Blood concentration–time profiles of HupA following intranasal administration of HupA PLGA NPs, TMC NPs, and Lf-TMC NPs. Data represented the mean ± SD (n=3). Brain biodistribution of HupA following intranasal administration of HupA loaded NPs in the (B) olfactory bulb, (C) cerebrum with hippocampus removed, (D) cerebellum, and (E) hippocampus.
Abbreviations: HupA, Huperzine-A; PLGA, polylactide-co-glycoside; Lf, lactoferrin; TMC, N-trimethylated chitosan; NPs, nanoparticles.