
Figures & data
Figure 1 Schematic representation of the surface chemistry used to covalently bind p53 and COP1 to AFM tips and substrate, respectively.
Notes: (A) p53 protein was linked to the AFM tip through the −NH2 groups of lysines exposed on the protein surface after the tip functionalization with MPTMS and NHS-PEG-MAL crosslinker. (B) COP1 protein was immobilized over the aldehyde-functionalized glass surface by randomly targeting amino groups of lysine residues exposed on the protein surfaces.
Abbreviations: AFM, atomic force microscopy; COP1, constitutive photomorphogenesis protein 1; MPTMS, 3-mercatopropyl-trimethoxysilane; NHS-PEG-MAL, N-hydroxysuccinimide-polyethyleneglycol-maleimide.
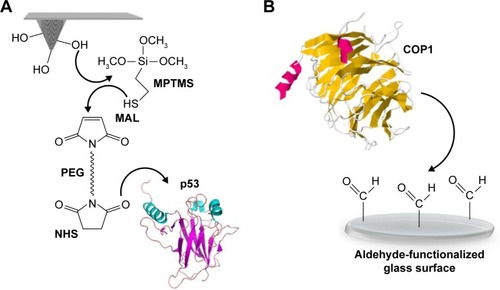
Figure 2 A typical approach–retraction cycle of the p53-functionalized tip over the COP1-functionalized substrate showing a specific unbinding event.
Notes: (1) The tip moves toward the substrate. (2) The tip reaches the contact point. (3) A further pressure toward the substrate causes an upward deflection of the cantilever. (4) During the retraction, the cantilever bends downward due to the attractive interaction force of the p53-COP1 complex. (5) The cantilever jumps off, returning to its initial position.
Abbreviation: COP1, constitutive photomorphogenesis protein 1.
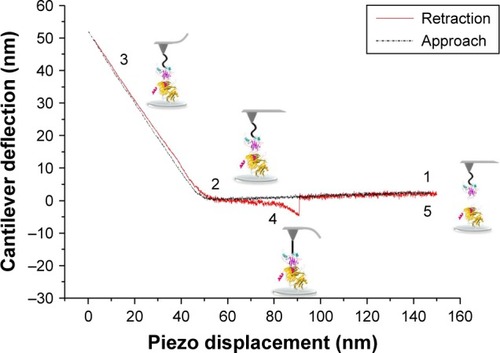
Figure 3 TM-AFM images recorded in air of COP1, p53, and preincubated p53–COP1 molecules adsorbed on a mica substrate.
Notes: (A) COP1 sample displaying isolated single spots; inset: cross-section profile of the spot indicated by the white arrow. (B) p53 sample showing single (yellow arrow) and bimolecular spots (green arrow); yellow inset: cross-section profile of the single spot and green inset: cross-section profile of the bimolecular spot. (C) p53–COP1 sample showing bimolecular complexes; inset: cross-section profile of the complex indicated by the white arrow.
Abbreviations: COP1, constitutive photomorphogenesis protein 1; TM-AFM, tapping mode-atomic force microscopy.
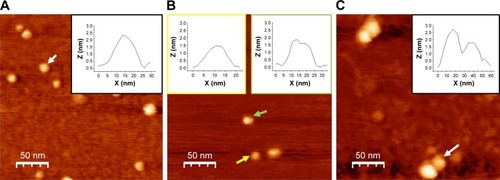
Figure 4 Analysis of AFS results for the p53–COP1 complex.
Notes: (A) Histogram of the unbinding forces for the p53–COP1 complex from AFS measurements carried out at a loading rate of 7 nN/s. The most probable unbinding force value (F*) was determined from the maximum of the main peak of the histogram by fitting with Gaussian function (black curve). (B) Plot of the most probable unbinding forces, F*, versus the logarithm of the loading rates for the p53–COP1 interaction. The solid line is the best fit of the experimental data by the Bell–Evans model (EquationEquation 2(2) ); the extracted parameters koff and xβ being reported. koff, dissociation rate constant; xβ, width of the energy barrier along the direction of the applied force.
Abbreviations: AFS, atomic force spectroscopy; COP1, constitutive photomorphogenesis protein 1.
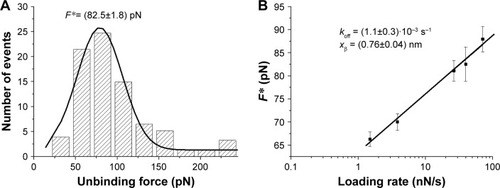
Figure 5 SPR single-cycle kinetic (SCK) of p53–COP1 interaction.
Notes: Sensorgrams (black dotted curves) of the response (resonance units, RU) versus time of the SCK performed by injecting five increasing concentrations (1.5, 3, 5, 10, and 20 nM) of p53 over the COP1-functionalized substrate (A) or of COP1 over the p53-functionalized substrate (B). The red solid curves were obtained by fitting data with the 1:1 binding model (EquationEquation 4(4) ) (BiaEvaluation software). Insets: plot of SPR response at the steady state versus the p53 (A) or COP1 (B) concentration used for the binding assays. The black curves were obtained by fitting data with the Langmuir isotherm (EquationEquation 5
(5) ) (BiaEvaluation software).
Abbreviations: COP1, constitutive photomorphogenesis protein 1; SPR, surface plasmon resonance.
![Figure 5 SPR single-cycle kinetic (SCK) of p53–COP1 interaction.Notes: Sensorgrams (black dotted curves) of the response (resonance units, RU) versus time of the SCK performed by injecting five increasing concentrations (1.5, 3, 5, 10, and 20 nM) of p53 over the COP1-functionalized substrate (A) or of COP1 over the p53-functionalized substrate (B). The red solid curves were obtained by fitting data with the 1:1 binding model (EquationEquation 4d[Asurface]dt=kt([Abulk]−[Asurface])−(kon[L][Asurface]−koff[LA])d[L]dt=−(kon[L][Asurface]−koff[LA])d[LA]dt=(kon[L][Asurface]−koff[LA])(4) ) (BiaEvaluation software). Insets: plot of SPR response at the steady state versus the p53 (A) or COP1 (B) concentration used for the binding assays. The black curves were obtained by fitting data with the Langmuir isotherm (EquationEquation 5Req=[p53]RmaxKD+[p53]+RI(5) ) (BiaEvaluation software).Abbreviations: COP1, constitutive photomorphogenesis protein 1; SPR, surface plasmon resonance.](/cms/asset/987d89e5-31f8-4371-a5a6-294bb3751c92/dijn_a_12193910_f0005_c.jpg)