
Figures & data
Figure 1 The flow chart of the whole analysis in this study.
Abbreviation: PGM, probabilistic graphical model.
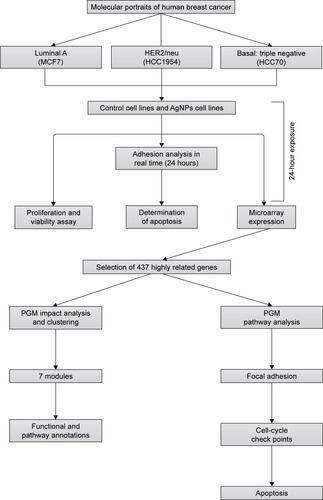
Figure 2 Characterization of AgNPs. (A) Ultraviolet–visible spectra of AgNPs. (B) Transmission electron microscopy of AgNPs. (C) Histogram of the size of the particles.
Abbreviations: AgNPs, silver nanoparticles; AU, arbitrary unit.
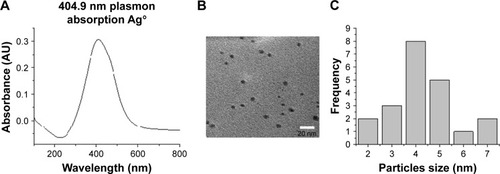
Figure 3 Adhesion analysis in real time: presented as mean and standard deviation; differences were calculated using Mann–Whitney U-test p<0.05 (*). MCF7 (A), HCC1954 (B), and HCC70 (C) cell lines.
Abbreviation: AgNPs, silver nanoparticles.
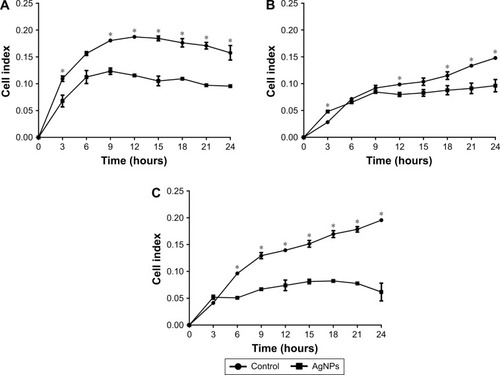
Figure 4 Proliferation and viability: presented as mean and standard deviation; differences were calculated by the Student’s t-test. P<0.01 (**).
Abbreviation: AgNPs, silver nanoparticles.
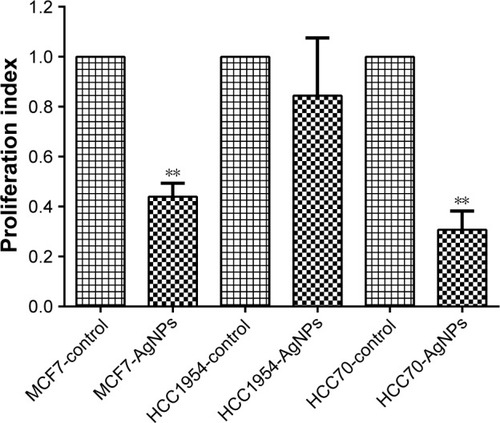
Figure 5 Determination of apoptosis: cells were stained with Annexin V-fluorescein isothiocyanate (FLl) and propidium iodide (FL2), and cell apoptosis was analyzed by flow cytometry. (A) Total apoptosis percentage presented as mean and standard deviation; differences were calculated by the Student’s t-test. P<0.01 (**). (B–D) Dot plots representative of each cell line.
Abbreviation: AgNPs, silver nanoparticles.
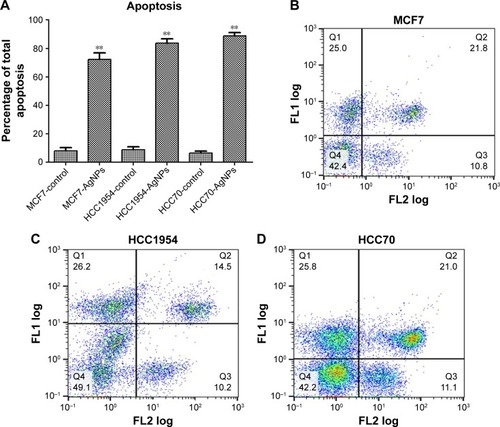
Figure 6 Gene expression heat map of 437 selected genes in each cell line.
Abbreviation: AgNPs, silver nanoparticles.
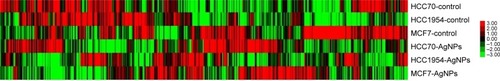
Table 1 PGM impact analysis
Figure 7 MEN of protein impact score. (A) Control cell lines and (B) cell lines treated with AgNPs.
Abbreviations: AgNPs, silver nanoparticles; MEN, minimal essential network.
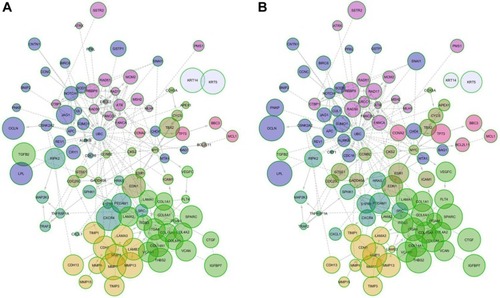
Table 2 Pathways identified in modules
Table 3 PGM pathway analysis