Figures & data
Figure 1 TEM image of TiO2 NPs.
Notes: A representative TEM image of TiO2 NPs suspended in tragacanth solution is shown. Red arrows show TiO2 NPs.
Abbreviations: TiO2 NPs, titanium dioxide nanoparticles; TEM, transmission electron microscope.
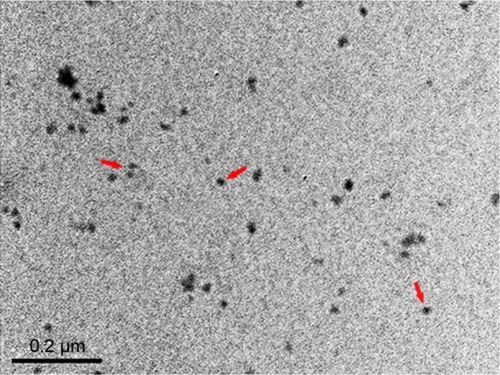
Table 1 Absolute and relative organ weights of mice on GD 13
Figure 2 Effect of TiO2 NP exposure on the numbers of implanted embryo.
Notes: (A) Representative images of implanted embryo in uteri on GD 13; black arrows show resorbed sites. (B) The numbers of implanted embryo in GD 13 mice; white bar represents viable embryos and gray bar represents resorbed embryos. Results are shown as mean ± SEM of 10 animals.
Abbreviations: TiO2 NPs, titanium dioxide nanoparticles; GD, gestational day; SEM, standard error of mean.
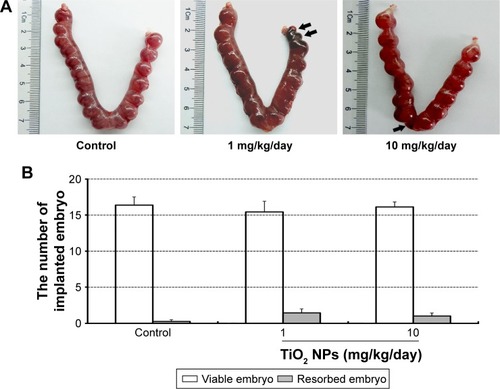
Figure 3 Effect of TiO2 NP exposure on the weight of placenta.
Notes: (A) Representative images of placentas collected on GD 13; (B) the weight of placenta; (C) the ratio of placenta/body weight on GD 13. The data are presented as means ± SEM of 10 animals. *P<0.05 compared with control.
Abbreviations: TiO2 NPs, titanium dioxide nanoparticles; GD, gestational day; SEM, standard error of mean.
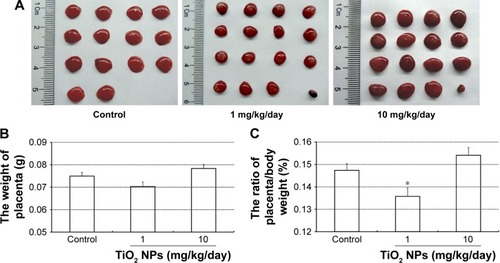
Figure 4 Effect of TiO2 NP exposure on placental histopathology.
Notes: (A) Representative images of placental section observed by H&E staining. Scale bar, 50 μm. (B) The ratio of spongiotrophoblast/total area of placenta (%). (C) The ratio of labyrinth/total area of placenta (%). Data are represented as means ± SEM of 10 animals. *P<0.05 compared with control.
Abbreviations: TiO2 NPs, titanium dioxide nanoparticles; H&E, hematoxylin and eosin; SEM, standard error of mean; de, decidua; sp, spongiotrophoblast; lab, labyrinth.
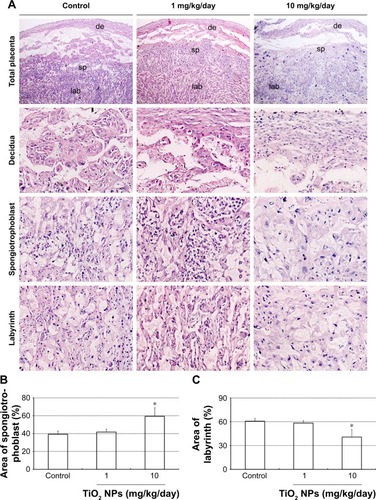
Figure 5 Effect of TiO2 NP treatment on placental gene expression.
Notes: (A–F) Relative expression levels of Hand1 (A), Esx1 (B), Eomes (C), Hand2 (D), Ascl2 (E) and Fra1 mRNA (F) in mice placentas treated by control, 1 and 10 mg/kg/day TiO2 NPs on GD 13. mRNA levels were quantified using reverse transcription-quantitative polymerase chain reaction and normalized to 18S rRNA. Data are presented as means ± SEM of 6 animals. ***P<0.001 compared to control.
Abbreviations: TiO2 NPs, titanium dioxide nanoparticles; GD, gestational day; SEM, standard error of mean.
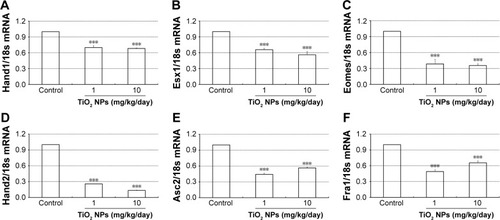
Figure 6 Effect of TiO2 NP treatment on the labyrinth vascularization of placenta.
Notes: (A–C) Laminin immunohistochemical staining of mice placentas treated by control (A), 1 (B) and 10 mg/kg/day (C) TiO2 NPs. Boxed areas in A–C were imaged with four-times higher magnification (D–F, respectively). Inset of F shows immunostaining of a negative control-stained section (primary antibody was replaced by normal rabbit serum). Black arrows show fetal vessels.
Abbreviation: TiO2 NPs, titanium dioxide nanoparticles.
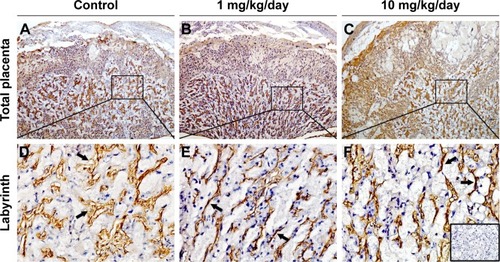
Figure 7 Effect of TiO2 NP exposure on the numbers of uNK cells in placental decidua.
Notes: (A–C) DBA lectin staining of whole placental sections collected from animals, which were administered by control (A), 1 (B) and 10 mg/kg/day (C) TiO2 NPs. Boxed areas in A–C were imaged with four-times higher magnification (D–F, respectively). Inset of F shows immunostaining of a negative control section (stained with the addition of 0.1 M N-acetyl-D-galactosamine to the DBA lectin incubation). (G) The numbers of uNK cells in placental decidua of mice on GD 13. Data are presented as the means ± SEM of 6 animals. ***P<0.001 compared with control.
Abbreviations: TiO2 NPs, titanium dioxide nanoparticles; GD, gestational day; SEM, standard error of mean.
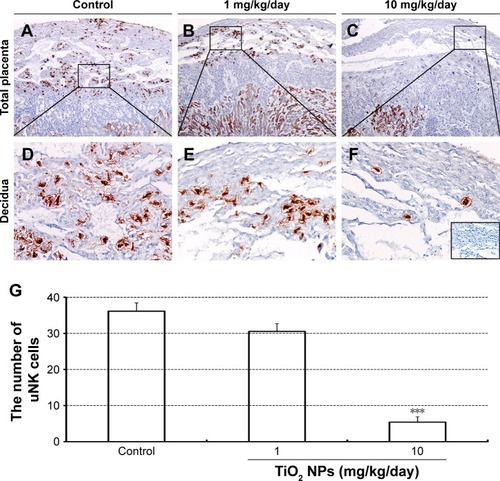
Figure 8 Effect of TiO2 NP exposure on the proliferation of placenta.
Notes: (A–B) PCNA immunohistochemical staining of whole placental sections collected from animals, which were administered by control (A), 1 (B) and 10 mg/kg/day (C) TiO2 NPs. Boxed areas in A–C were imaged with two-times higher magnification (D–F, respectively). Inset of D shows immunostaining of a negative control section (primary antibody was replaced by normal rabbit serum). (G) The numbers of PCNA-positive cells in placental labyrinth of mice on GD 13. Data are presented as means ± SEM of 6 animals. *P<0.05, ***P<0.001 compared with control.
Abbreviations: TiO2 NPs, titanium dioxide nanoparticles; lab, labyrinth; GD, gestational day; SEM, standard error of mean.
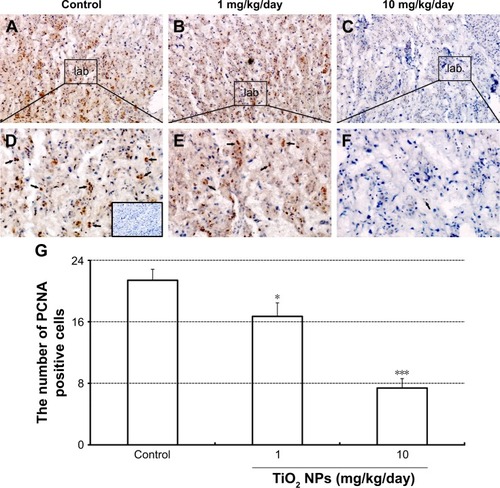
Figure 9 Effect of TiO2 NP exposure on the placental ultrastructure by TEM evaluation.
Notes: (A–F) Representative TEM images of placental sections collected from animals, which were administered by control (A, D), 1 (B, E) and 10 mg/kg/day (C, F) TiO2 NPs. (A–C) Representative TEM images of cell nucleus parts. Red arrows show nucleus. (D–F) Representative TEM images of cell cytoplasm parts.
Abbreviations: TiO2 NPs, titanium dioxide nanoparticles; TEM, transmission electron microscope; SER, smooth endoplasmic reticulum; RER, rough endoplasmic reticulum.
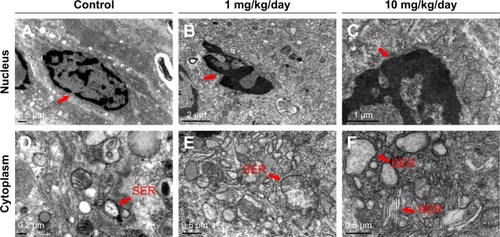
Figure 10 Effect of TiO2 NP exposure on the apoptosis of placenta.
Notes: (A) Representative immunoblotting images of Casp-3, Bax and Bcl-2 proteins in the TiO2 NP-treated placentas. (B–D) Densitometric values from Western blot analyses of Bcl-2 (B), Bax (C) and cleaved-Casp-3 (D) proteins. The data are normalized to β-actin expression (but cleaved-Casp-3 is normalized to Casp-3) and shown as mean ± SEM of 6 animals. *P<0.05, **P<0.01, ***P<0.001 compared with control.
Abbreviations: TiO2 NPs, titanium dioxide nanoparticles; Casp-3, caspase-3; SEM, standard error of mean.
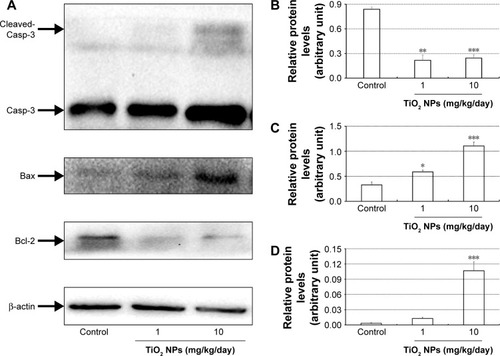
Figure S1 The x-ray diffraction peak of anatase TiO2 NPs.
Note: X-ray-diffraction (XRD) measurements showed that TiO2 NPs exhibited the anatase structure, and the average particles size calculated from the XRD peak of anatase was <25 nm using Scherrer’s equation (sigma-aldrich Co., Ltd).
Abbreviation: TiO2 NPs, titanium dioxide nanoparticles.
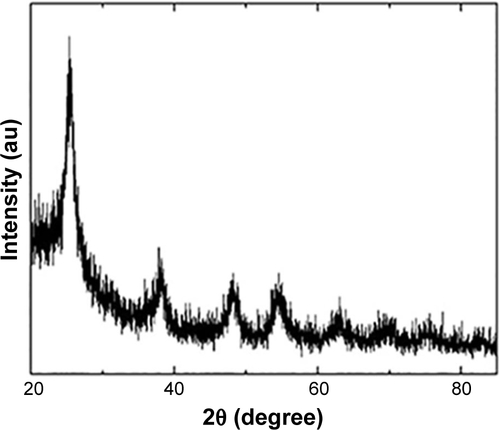
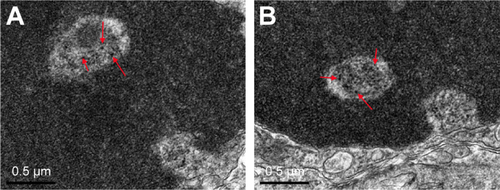
Figure S2 TEM evaluation of placental cell ultrastructure in pregnant mice caused by an intragastric administration with 10 mg/kg/day TiO2 NPs for 13 consecutive days. (A, B) Arrows indicate that TiO2 NPs aggregated in the nucleus of placental cells.
Abbreviations: TiO2 NPs, titanium dioxide nanoparticles; TEM, transmission electron microscope.