Figures & data
Figure 1 (A) Physicochemical characteristics of the HER-2-specific aptamer-targeted Ecoflex® nanoparticles loaded with DTX in comparison to non-targeted Ecoflex nanoparticles loaded with DTX. (B) Particle size and zeta potential diagrams of non-targeted Ecoflex nanoparticles loaded with DTX. (C) Particle size and zeta potential diagrams of aptamer-targeted Ecoflex nanoparticles loaded with DTX.
Abbreviations: DTX, docetaxel; PDI, polydispersity index; Apt-DTX-NPs, aptamer-conjugated nanoparticles loaded with docetaxel; RE30, drug release efficiency in 30 hours.
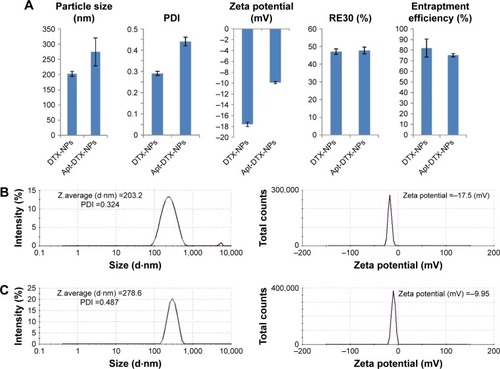
Figure 2 Micrographs obtained after immunohistochemistry test on cell suspensions of (A) SKOV-3 cells (HER-2-positive) and (B) MDA-MB-468 cells (HER-2-negative) to compare the presence of HER-2 receptors; and (C) micrographs of SKOV-3 tumor tissue, indicating the presence of HER-2 receptors on cell membrane (considered as 3+ score), defined as strong complete membrane staining in more than 30% of tumor cells.
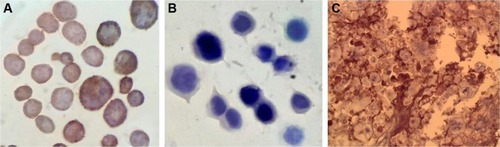
Figure 3 Viability percent after 24 hours incubation of (A) SKOV-3 cells treated with DTX-NPs, Apt-DTX-NPs, and free drug with different concentrations in the range of 100–1,000 ng/mL, and (B) MDA-MB-468 cells treated with DTX-NPs, Apt-DTX-NPs, and free drug with different concentrations in the range of 10–100 ng/mL, and compared to control samples including blank NPs (NPs which were not loaded with DTX) and DMSO (in the maximum concentration used in treatment groups).
Note: Significant differences are marked as *p<0.05.
Abbreviations: DTX, docetaxel; DTX-NPs, non-targeted nanoparticles loaded with docetaxel; Apt-DTX-NPs, aptamer-conjugated nanoparticles loaded with docetaxel; Blank NPs, nanoparticles not loaded with DTX; DMSO, dimethyl sulfoxide.
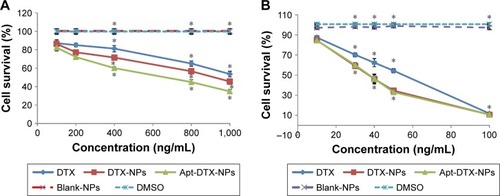
Figure 4 Flow-cytomertry diagrams indicating the intensity of fluorescence in SKOV-3 (A) and MDA-MB-468 (B) cells, following 2 hours incubation with 1) blank NPs (NPs which were not loaded with RhB), 2) free RhB, 3) RhB-NPs (non-targeted nanoparticles loaded with RhB), and 4) Apt-RhB-NPs (aptamer-conjugated nanoparticles loaded with RhB).
Note: M1 portion represents autofluorescence of the nontreated cells and M2 portion represents any additional intensity of fluorescence caused by uptake of probe.
Abbreviations: FL, fluorescence; RhB, Rhodamine B.
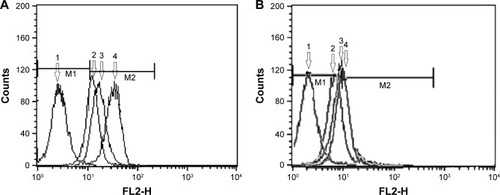
Table 1 Pharmacokinetic parameters of Taxotere® and Apt-DTX-NPs (results are presented as mean ± SD; n=3)
Figure 5 Mean plasma concentration–time profile of docetaxel (DTX) in Balb/c mice following intravenous administration of Taxotere®, DTX-NPs (non-targeted nanoparticles loaded with docetaxel), and Apt-DTX-NPs (aptamer-conjugated nanoparticles loaded with docetaxel). The results are indicated as mean ± SD (n=3).
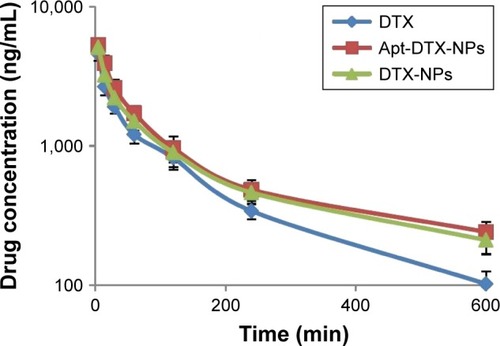
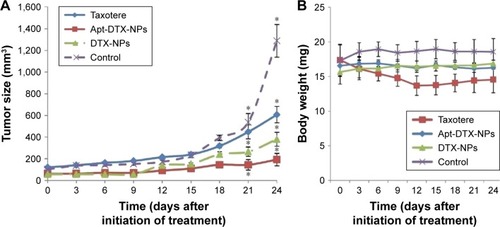
Figure 6 Tumor inhibition effect of different treatments by (A) changes in tumor volume and (B) changes in body weight of mice after treatment with normal saline (control group), Taxotere®, Apt-DTX-NPs (aptamer-conjugated nanoparticles loaded with docetaxel), and DTX-NPs (non-targeted nanoparticles loaded with docetaxel). The results are indicated as mean ± SD (n=3) and significant differences are marked as *p<0.05.