Figures & data
Table 1 Specific concentrations of each sample used for viability experiments
Table 2 Dimensional characterization and process yield of PLGA, PLGA-TZ and PLGA-TZ-DOXO NPs
Figure 1 Characterization of nanoencapsulated and released TZ.
Notes: TEM images of (A) PLGA, (B) PLGA-TZ and (C) PLGA-TZ-DOXO NPs. (D) Far-UV CD spectra of CTZ and RTZ. (E) Fluorescence emission spectra of different released TZ (24, 48, 72 and 96 h) compared to a standard solution of native TZ (27.2 µg mL−1).
Abbreviations: TZ, trastuzumab; TEM, transmission electron microscope; PLGA, poly(lactic-co-glycolic) acid; DOXO, doxorubicin; NP, nanoparticle; CD, circular dichroism; CTZ, control TZ; RTZ, released TZ.
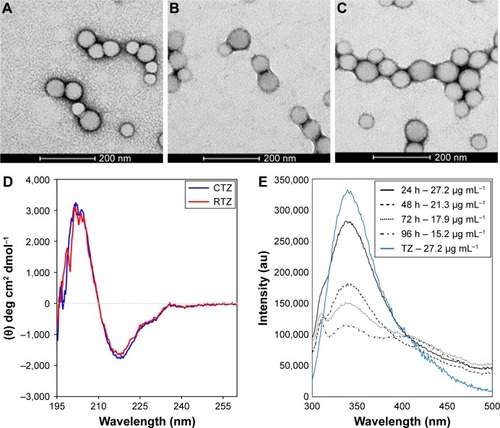
Figure 2 HER2 binding of released TZ from PLGA NPs.
Notes: (A) TZ-FITC binding on SKBR3 cells after treatment with RIgG, CTZ and RTZ at two different concentrations (2 and 20 µg mL−1) for 24 and 48 h. Data are represented as the mean of fluorescence intensity of three independent replicates ± SD acquiring 10,000 events for each sample by flow cytometry. (B–E) Confocal microscopy images of TZ-FITC binding on SKBR3. (B) Basal binding of TZ-FITC; (C, D and E) binding of TZ-FITC after pre-treatment of RIgG, CTZ and RTZ, respectively, for 24 h at 37°C. Cells were labeled with DAPI (nuclei) and WGA-555 (membranes). Scale bar =50 µm. ****P<0.01 vs UNTR; **P<0.05 vs UNTR.
Abbreviations: HER2, human epidermal growth factor receptor 2; TZ, trastuzumab; PLGA NPs, poly(lactic-co-glycolic) acid nanoparticles; FITC, fluorescein isothiocyanate; RIgG, released IgG; CTZ, control TZ; RTZ, released TZ; SD, standard deviation; CNTR, cells without any labeling; UNTR, cells coated with TZ-FITC.
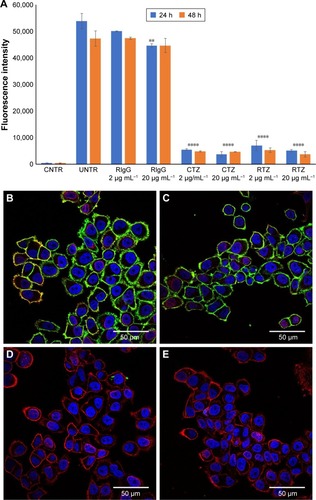
Figure 3 HER2 phosphorylation.
Notes: (A) Analysis of pHER2 (Y1248) and HER2 expression on SKBR3 cells after treatment with control CTZ and RTZ at 2 µg mL−1 for 4 and 24 h; (B) Analysis of HER2 expression on SKBR3 cells after treatment with PLGA-TZ at 2 µg mL−1 for 4 and 24 h. Values were calculated as ratio between pHER2/HER2 and HER2/b-actin and normalized with untreated cells (UNTR).
Abbreviations: HER2, human epidermal growth factor receptor 2; CTZ, control trastuzumab; RTZ, released trastuzumab; PLGA-TZ, trastuzumab-loaded poly(lactic-co-glycolic) acid nanoparticles; UNTR, cells without treatment.
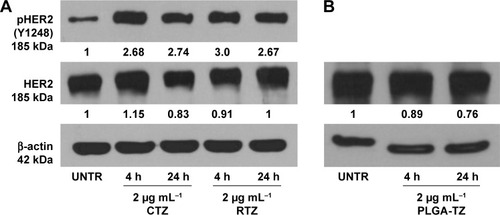
Figure 4 Interaction of TZ with intracellular processes.
Notes: Confocal microscopy images of endocytosis mechanism of (A) TZ-FITC and (B) PLGA (TZ-FITC) in SKBR3. Cells were labeled with DAPI (nuclei), mouse AbII-Alexa555 against EEA1 or CatD. Arrows indicate the co-localization of FITC with Alexa555 of AbII. Scale bar = 50 µm.
Abbreviations: TZ, trastuzumab; FITC, fluorescein isothiocyanate; PLGA, poly(lactic-co-glycolic) acid.
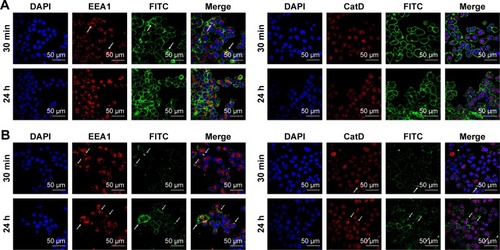
Figure 5 Combination therapy with PLGA nanocarriers.
Notes: (A) Viability assay of SKBR3 treated with different concentrations of DOXO, PLGA-DOXO and PLGA-DOXO-TZ keeping constant the concentration of DOXO (0.01, 0.1, 1 and 5 µM) for 24, 48 and 72 h. (B) Viability assay of SKBR3 treated with PLGA, PLGA-TZ and TZ (for concentrations see ) for 24, 48 and 72 h. Data are represented as a mean ± SD of three independent replicates. **P<0.05 vs UNTR (100%); ***P<0.01 vs UNTR (100%); #P<0.01 vs PLGA-DOXO-TZ; @P<0.01 vs PLGA-TZ.
Abbreviations: PLGA, poly(lactic-co-glycolic) acid; DOXO, doxorubicin hydrochloride; TZ, trastuzumab; SD, standard deviation; UNTR, cells without treatment.
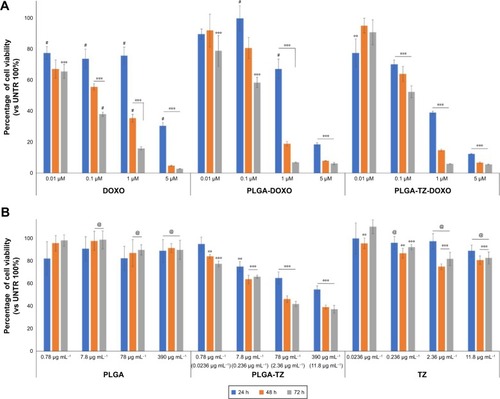
Figure 6 RTZ induced the same level of ADCC mechanism as that of control TZ.
Notes: ADCC mechanism induced by TZ, RTZ and RIgG on SKBR3 cells with E:T ratio of 20:1 (A) and 40:1 (B). Data are represented as percentage of mean ± SD of three independent replicates. **P<0.05 vs E:T; ***P<0.01 vs E:T; #P<0.01 vs TZ at the same concentrations ns vs E:T.
Abbreviations: RTZ, released trastuzumab; ADCC, antibody-dependent cell-mediated cytotoxicity; RIgG, released IgG; E:T, effector:target; SD, standard deviation; ns, not significant.
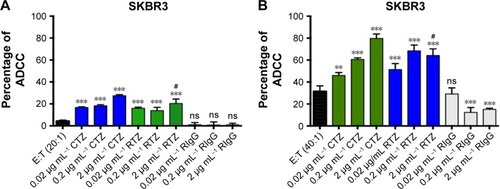
Figure S1 Synthesis of TZ-loaded polymeric NPs.
Note: Schematic description of the synthetic procedure to obtain double-loaded PLGA-NPs.
Abbreviations: TZ, trastuzumab; NPs, nanoparticles; PLGA, poly(lactic-co-glycolic) acid.
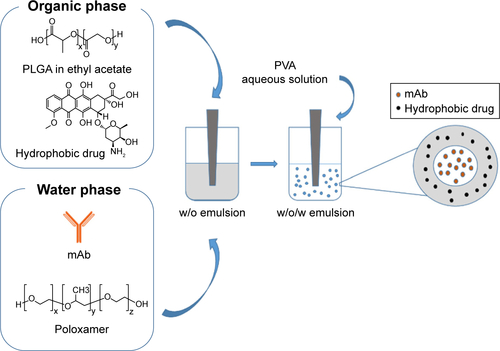
Figure S2 Evaluation of TZ secondary structure integrity after release.
Notes: (A) Protein secondary structure content determined from CD spectra by using the BeStSel method. Error bars represent the standard deviations of the results obtained from the analysis of six independent CD spectra for each sample. (B) Second-derivatives of the FTIR absorption spectra of CTZ and RTZ in the Amide I region. Second derivative minima allow for identification of the main absorption components. The main peaks at ~1,692 cm−1 and at ~1,641 cm−1 are assigned to the native β-sheet structures of the proteins in agreement with previous FTIR characterizations.
Abbreviations: TZ, trastuzumab; CD, circular dichroism; FTIR, Fourier transform infrared; CTZ, control TZ; RTZ, released TZ.
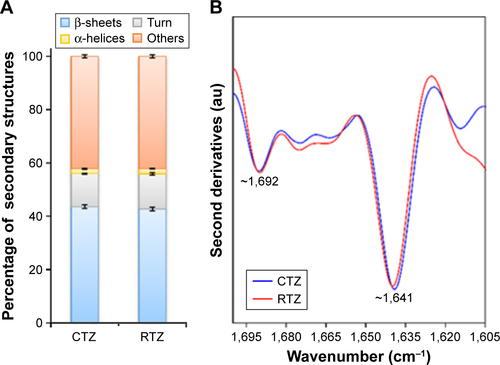
Figure S3 Dynamic light scattering measurement of NPs.
Notes: Size distribution of PLGA, PLGA-TZ and PLGA-TZ-DOXO. Results are expressed as intensity distribution. Data are representative of the average size distribution of at least three batches of nanoparticles.
Abbreviations: NPs, nanoparticles; PLGA, poly(lactic-co-glycolic) acid; TZ, trastuzumab; DOXO, doxorubicin.
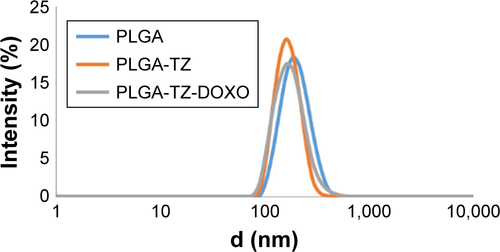
Figure S4 In vitro release test.
Note: (A) TZ and (B) DOXO cumulative release in vitro.
Abbreviations: TZ, trastuzumab; DOXO, doxorubicin.
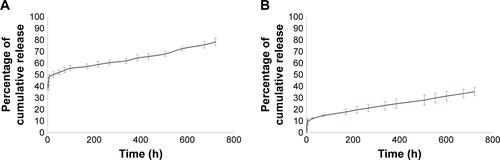
Figure S5 Evaluation of TZ primary structure integrity after release.
Note: SDS-PAGE performed on RTZ, TZ extracted with NaOH (TZ_NaOH) and unloaded TZ (TZ_wash) compared to CTZ as reference.
Abbreviations: SDS-PAGE, sodium dodecyl sulfate-polyacrylamide gel electrophoresis; TZ, trastuzumab; RTZ, released TZ; CTZ, control TZ.
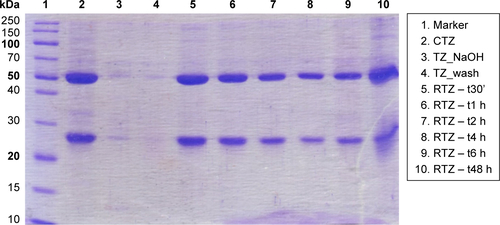
Figure S6 Binding of TZ-FITC.
Notes: (A) Basal binding of CTZ, RTZ and RIgG labeled with FITC to SKBR3 cell line. (B) Percentage of TZ-FITC binding on SKBR3 after 24 and 48 h of treatment with 2 µg mL−1 and 20 µg mL−1 of CTZ, RTZ and RIgG. ****P<0.01 vs UNTR.
Abbreviations: TZ, trastuzumab; FITC, fluorescein isothiocyanate; CTZ, control TZ; RTZ, released TZ; RIgG, released IgG; UNTR, cells coated with TZ-FITC.
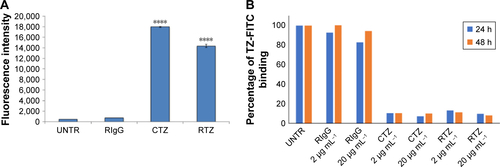
Figure S7 Western blot of unspecific IgG.
Notes: Analysis of HER2 expression on SKBR3 cells after treatment with CIgG, RIgG and IgG@PLGA at 2 µg mL−1 for 24 h. Values were calculated as ratio between HER2/β-actin and normalized with untreated cells (UNTR).
Abbreviations: HER2, human epidermal growth factor receptor 2; CIgG, control IgG; RIgG, released IgG; IgG@PLGA, IgG-loaded PLGA NPs; UNTR, cells without treatment.
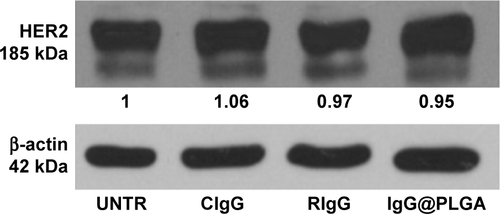
Figure S8 Confocal microscopy.
Notes: Confocal microscopy untreated cells labeled with DAPI (nuclei), EEA1 (early endosomes) and CatD (lysosomes). Scale bar =50 µm.
Abbreviations: DAPI, 4′,6-diamidin-2-fenilindolo; EEA1, Early Endosome Antigen 1; CatD, Cathepsin D.
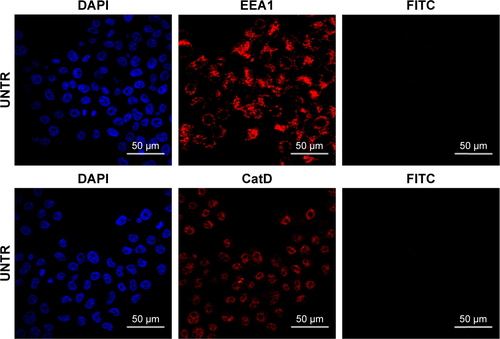
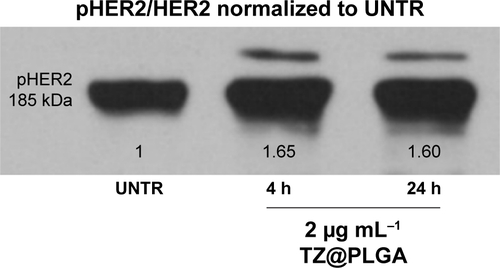
Figure S9 Western blot of unspecific IgG.
Notes: Analysis of pHER2 expression on SKBR3 cells after treatment with TZ@PLGA at 2 µg mL−1 for 4 h and 24 h. Values were calculated as ratio between pHER2/HER2 and normalized with untreated cells (UNTR).
Abbreviations: HER2, human epidermal growth factor receptor 2; TZ@PLGA, trastuzumab-loaded poly(lactic-co-glycolic) acid nanoparticles; UNTR, cells without treatment.