Figures & data
Figure 1 Schematic of sequence of Aβ42 conjugation to AuNP surface via biotin–streptavidin interaction and formation of AuNP–Aβ42 precipitate by Aβ42 aggregation.
Abbreviations: Aβ amyloid β Aβ42, amyloid β42; AuNP, gold nanoparticle.
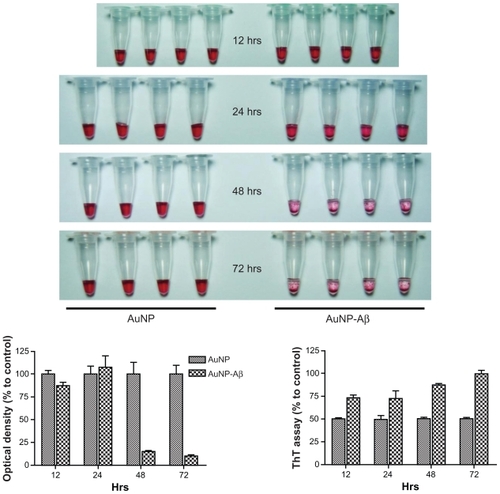
Figure 2 Confirmation of Aβ42 conjugation to AuNP and induction of AuNP–Aβ42 precipitates by Aβ42 aggregation. A) Verification of biotin–Aβ42 conjugation to streptavidin-AuNP by dot blot analysis. B) After 48 hours incubation, visible AuNP–Aβ42 precipitates formed in the bottom of the tubes and the supernatant became clear; no precipitate was observed in the AuNP control. C) Optical density of supernatant as a quantitative indicator of AuNP–Aβ42 precipitation (Paired t-test, ***P < 0.0001). D) ThT binding assay to measure and quantify Aβ42 aggregation, reflected by significantly increased ThT binding in AuNP–Aβ42 (**P < 0.005).
Abbreviations: Aβ42, amyloid β42; AuNP, gold nanoparticle; ThT, thioflavin T.
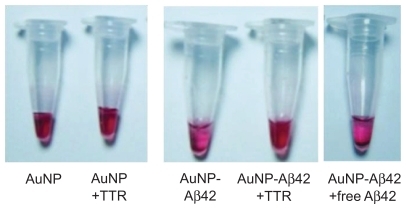
Figure 3 AuNP–Aβ42 precipitates in an Aβ42 concentration-dependent manner. Various concentrations of biotin–Aβ42 (0, 0.5, 1, 5, 10, 50, 100, and 300 μmol/L) were added to streptavidin-AuNP to determine the optimal concentration of Aβ42 conjugation. Visible precipitates developed at 50 μmol/L biotin–Aβ42 A), accompanied by a decrease in optical density B), and increase in ThT binding C), indicating that 10–50 μmol/L is the optimal concentration of Aβ42 to saturate AuNP surfaces and induce AuNP–Aβ42 aggregation. Above 50 μmol/L, free Aβ42 reverses the optical density despite the increased ThT value.
Abbreviations: Aβ42, amyloid β42; AuNP, gold nanoparticle; ThT, thioflavin T.
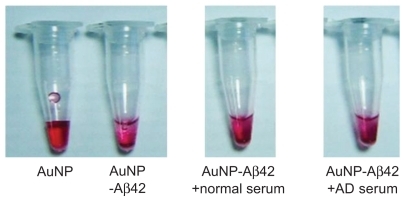
Figure 4 Activity validation of an Aβ aggregation inhibitor TTR, using AuNP–Aβ42 precipitates. In inducing AuNP–Aβ42 aggregation, its coincubation with TTR prevented the formation of visible AuNP–Aβ42 precipitates and maintained the red color of the colloidal solution, as in the AuNP control A). TTR reversed the significant decrease in optical density B), and increase in ThT value C) of AuNP–Aβ42, resulting from the inhibition of both Aβ aggregation and AuNP–Aβ42 and one-way ANOVA (*P < 0.05, **P < 0.01).
Abbreviations: Aβ, amyloid β; Aβ42, amyloid β42; AuNP, gold nanoparticle; ThT, thioflavin T; TTR, transtyretin.
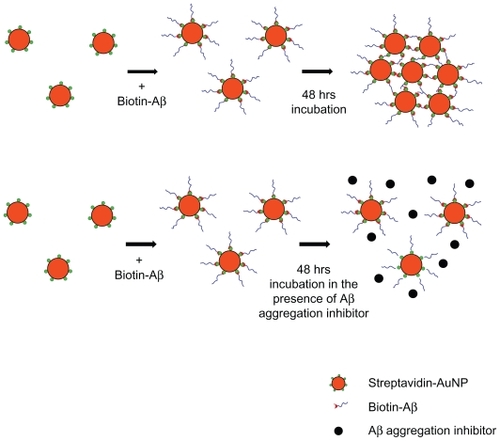
Figure 5 TEM analysis of AuNP–Aβ42 precipitates. A) AuNP–Aβ42 formed clusters with short interparticle distances, and AuNP underwent an even distribution of particles. The addition of free Aβ42 resulted in a similar pattern of aggregation as AuNP–Aβ42 but a greater interparticle distance and dark background staining. TTR blocked the formation of AuNP–Aβ42 aggregates and maintained the homogeneous dispersion of particles as evenly as the AuNP control. B) Interparticle distances were measured and compared (***P < 0.001 compared with AuNP, ###P < 0.001 compared with AuNP–Aβ42).
Abbreviations: Aβ42, amyloid β42; AuNP, gold nanoparticle; TEM, transmission electron microscopy; TTR, transtyretin.
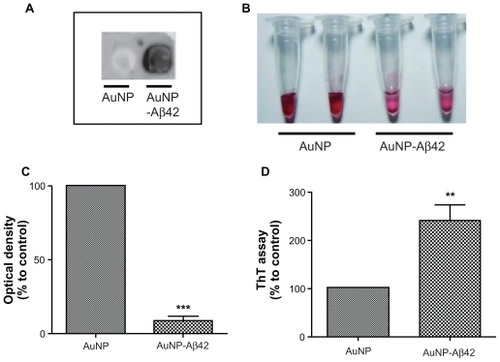
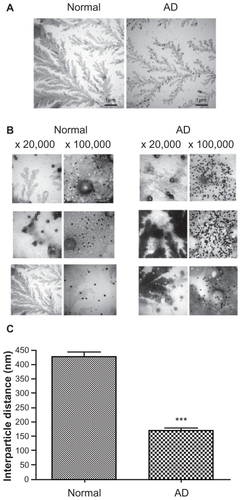
Figure 6 TEM analysis of AuNP–Aβ42 incubated with blood-derived serum from normal and AD patients. Sera from normal individuals (n = 4) and AD patients (n = 4) were incubated with AuNP–Aβ42 during aggregation. AuNP–Aβ42 in AD patient serum showed aggregation and significantly shorter interparticle distances (A right, B right, and C) (***P < 0.001), whereas AuNP–Aβ42 in normal serum dispersed evenly and represent regular distances (A left, B left, and C). Sera from both normal and AD patients developed irregular and dark backgrounds of protein aggregation (white scale bar in × 20,000 image: 200 μm, in × 100,000 image: 200 nm).
Abbreviations: AD, Alzheimer’s disease; Aβ42, amyloid β42; AuNP, gold nanoparticle; TEM, transmission electron microscopy.
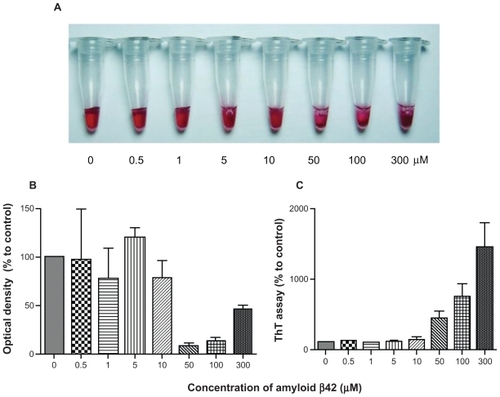
Figure S1 Time-dependent aggregation and precipitation pattern of AuNP–Aβ42.
Abbreviations: Aβ, amyloid β; Aβ42, amyloid β42; AuNP, gold nanoparticle; ThT, thioflavin T.
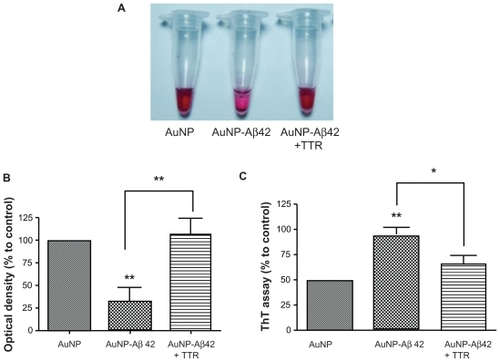
Figure S2 Precipitation pattern of AuNP–Aβ42 with or without TTR or free Aβ42. Images were taken before the TEM analysis in .
Abbreviations: Aβ42, amyloid β42; AuNP, gold nanoparticle; TEM, transmission electron microscopy; TTR, transtyretin.
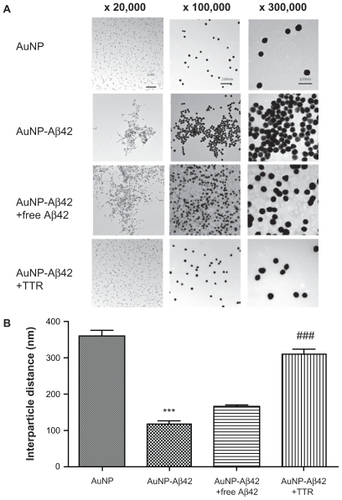
Figure S3 Precipitation pattern of AuNP–Aβ42 incubated with sera from normal and AD patients. Images were taken before TEM analysis in .
Abbreviations: AD, Alzheimer’s disease; Aβ42, amyloid β42; AuNP, gold nanoparticle; TEM, transmission electron microscopy.