Figures & data
Figure 1 Molecular self-assembling peptide RADA16-I was evaluated by TEM and AFM. A) Molecular model of RADA16-I with 16 amino acid residues and the alternating positive and negative residue’s arrangement. B) TEM of RADA16-I peptide nanofiber (magnified ×40,000). C) The interwoven nanofiber networks of RADA16-I peptide by AFM scan. D) High-resolution deflection image of RADA16-I peptide nanofiber. The nanofiber scaffold presented here was observed at least three times.
Abbreviations: TEM, transmission electron microscopy; AFM, atom force microscopy.
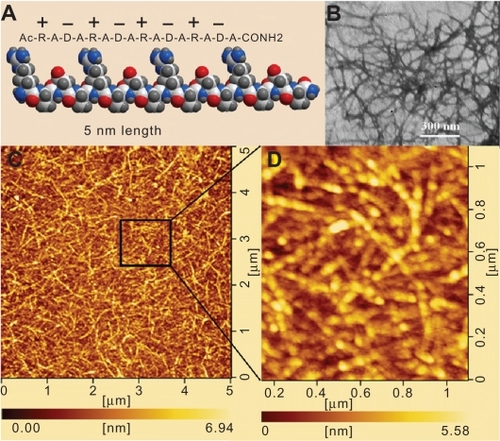
Figure 2 Phase contrast microscopy images of A–C) A2780, D–F) A2780/DDP, and G–I) SK-OV-3 cultured in RADA16-I peptide hydrogel on days 1, 3, and 7. The arrows indicate multicellular spheroids, cell clusters, or cell colonies. A, D, and G) indicate the initial cell morphology on the first day. B, E, and H) indicate the cell colonies of A2780, A2780/DDP, and SK-OV-3 after 3 days. C, F, and I) indicate the multicellular spheroids of A2780 and A2780/DDP and the cell clusters of SK-OV-3 after 7 days. All images are captured at ×200 magnification.
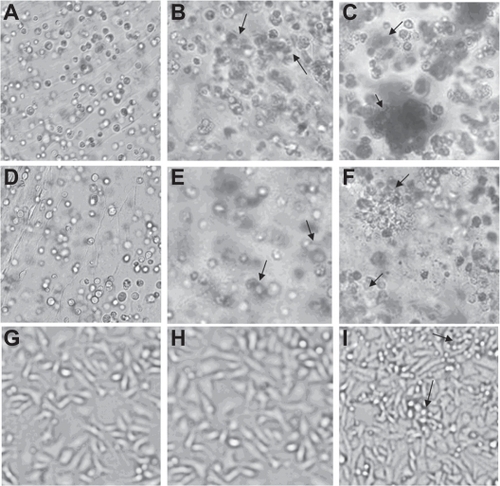
Figure 3 Cell viability of three ovarian cancer cell lines as a function of culture time. 5 × 10⁴ cells were seeded on the peptide nanofiber scaffold and monitored by an MTT assay with a microplate reader.
Abbreviation: MTT, 3-(4,5-dimethylthiazol-2-yl)-2, 5-diphenyl tetrazolium bromide.
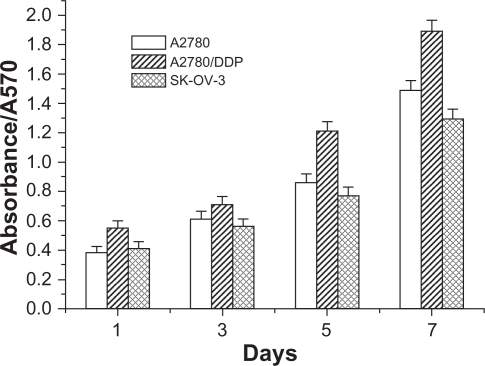
Figure 4 Adhesion behavior of the precultured A2780, A2780/DDP, and SK-OV-3 cells. A) The number of adhesion cells on the type I collagen, the peptide nanofiber, and BSA (control). B) The adhesion percentage of the precultured A2780, A2780/DDP, and SK-OV-3 cells on the scaffolds. The assay was conducted at least in triplicate.
Abbreviation: BSA, bovine serum albumin.
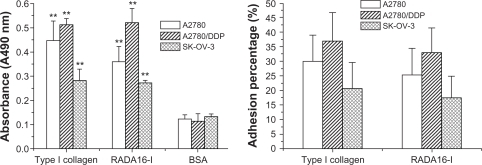
Figure 5 The migration and invasion of the precultured A2780, A2780/DDP, and SK-OV-3 cells. Relative normalized cell number per area was counted under the condition of phase contrast microscopy. This assay was performed in triplicate for every ovarian cancer cell line.
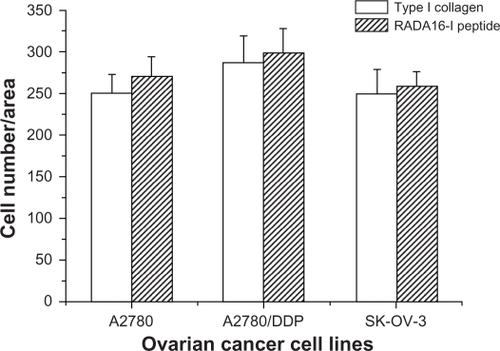
Table 1 IC50 concentration in the 2D Petri dish culture and chemotherapeutic assay in the 3D model
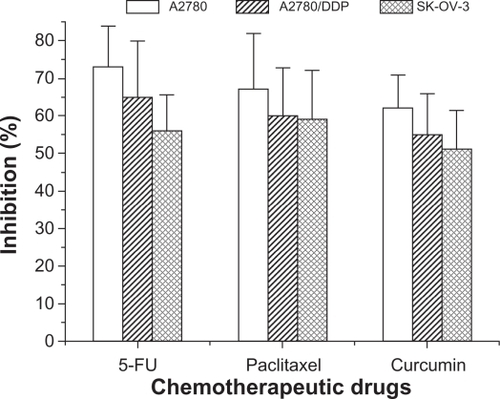
Figure 6 Chemotherapeutic effects of the anticancer drugs against the precultured ovarian cancer cells. Cancer cells in the conventional two-dimensional Petri dish and the precultured cancer cells in peptide nanofiber scaffold were evaluated by the cell viability after 24-h incubation.
Abbreviation: 5-FU,5-fluorouracil.