Figures & data
Figure 1 Device schematic and operation.
Notes: (A) Schematic representation of the micromixer device; the solvent is fed from the bottom side of the silicon nitride while antisolvent phase is introduced in the top layer. (B) A simplified summary of the fabrication steps, showing how the channel and the membranes are fabricated with RIE, KOH etching, and DRIE. (C) A Solidworks 3D model, showing how the piezoelectric disk is assembled into the device, and (D) experimental snapshots demonstrating the mixing of two liquids before and after acoustic actuations (fluorescent dye was used to enhance visualization).
Abbreviations: DRIE, deep reactive ion etching; KOH, potassium hydroxide; RIE, reactive ion etching; PDMS, polydimethylsiloxane.
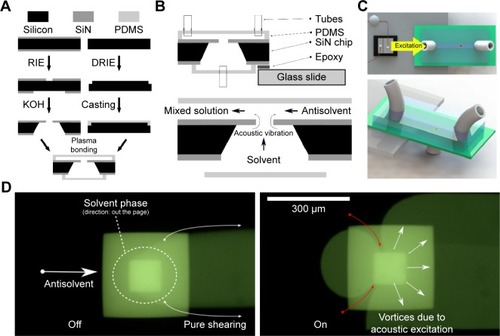
Figure 2 Comparison between different operational modes of the micromixer.
Notes: (A) Simplified schematic diagrams, and (B) DLS results, demonstrating the particle size and distribution for different modes, considering 10 measurements on 400 μL samples. The mean particle diameters and standard deviations are 99±80, 136±61, and 120±44 nm for modes 1, 2a, and 2b, respectively.
Abbreviation: DLS, dynamic light scattering.
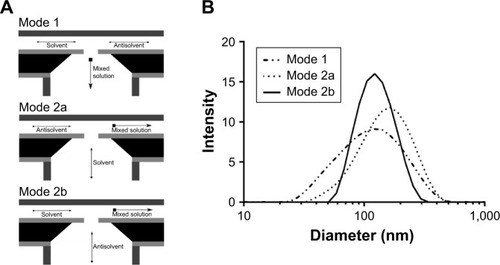
Figure 3 The effect of actuation on the particle diameter of budesonide – activation at 177.6 kHz with the flow rate of 8 μL/minute with a concentration of 0.2 mg/mL (results are based on 10 measurements).
Note: Inset: scanning electron micrograph of the particles (scale bar: 500 nm).
Abbreviation: PEG, polyethylene glycol.
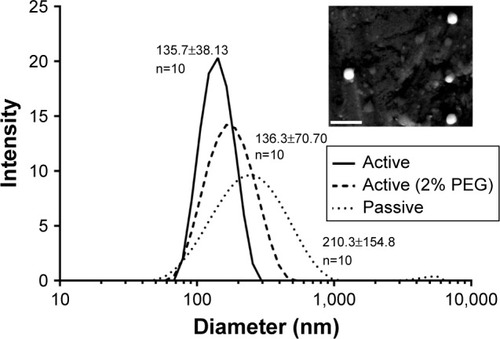
Figure 4 The effect of budesonide concentration on the mean size of nanoparticles.
Note: (A) DLS results and (B) mean diameter and standard deviations of the particle diameters as a function of the concentration (total flow rate: 20 μL/minute at 156.7 kHz actuation).
Abbreviation: DLS, dynamic light scattering.
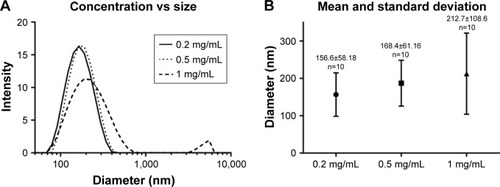
Figure 5 The effect of flow rate on the synthesized budesonide particles with the concentration of 0.2 mg/mL at a frequency of 177.6 kHz, for total flow rates 10, 20, 30, and 50 μL/minute (n=10).
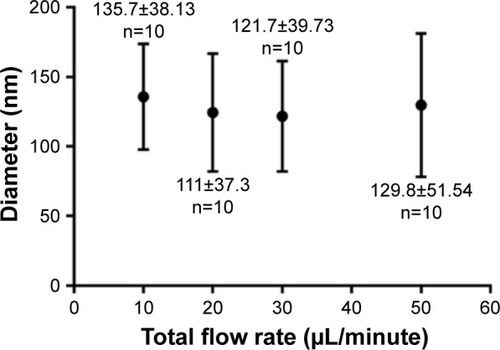
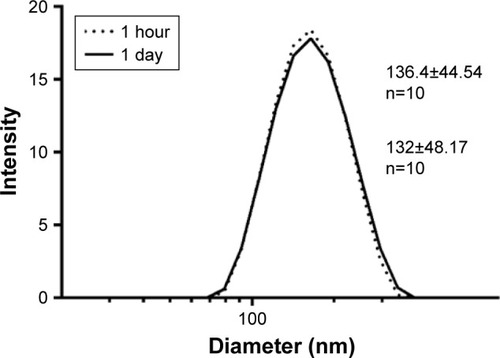
Figure 6 Stability of the budesonide particles.
Note: Particle size distribution 1 hour and 1 day after synthesis.