Figures & data
Figure 1 Synthesis and properties of AlPcS4 delivery complex.
Notes: (A1, B1, and C1) Transmission electron microscopy images of AuNR, CliP, and F127. (A2, B2, and C2) UV–vis absorption spectra of compounds in each reactive system. (A3, B3, and C3) Fluorescence spectra (include fluorescence emission spectra [—] and fluorescence excitation spectra [—]) of AuNR–AlPcS4 with or without 808 nm laser irradiation, Clip–AlPcS4, F127–AlPcS4, and AlPcS4. (A4, B4, and C4) Zeta potential of compounds in each reactive system.
Abbreviations: AlPcS4, Al(III) phthalocyanine chloride tetrasulfonic acid; Clip, cationic liposome; RRLAC, arginine-arginine-leucine-alanine-cysteine peptide.
![Figure 1 Synthesis and properties of AlPcS4 delivery complex.Notes: (A1, B1, and C1) Transmission electron microscopy images of AuNR, CliP, and F127. (A2, B2, and C2) UV–vis absorption spectra of compounds in each reactive system. (A3, B3, and C3) Fluorescence spectra (include fluorescence emission spectra [—] and fluorescence excitation spectra [—]) of AuNR–AlPcS4 with or without 808 nm laser irradiation, Clip–AlPcS4, F127–AlPcS4, and AlPcS4. (A4, B4, and C4) Zeta potential of compounds in each reactive system.Abbreviations: AlPcS4, Al(III) phthalocyanine chloride tetrasulfonic acid; Clip, cationic liposome; RRLAC, arginine-arginine-leucine-alanine-cysteine peptide.](/cms/asset/876e1f1a-f213-4930-9fd5-f3700d3bc09f/dijn_a_154054_f0001_c.jpg)
Figure 2 The anti-growth and antiproliferation effects of AuNR–AlPcS4, Clip–AlPcS4, and F127–AlPcS4 on SGC-7901 cells evaluated by the CCK-8 assay and colony formation assay.
Notes: (A–C) The dark cytotoxicity (without irradiation) and photocytotoxicity (with irradiation) of AuNR–AlPcS4, Clip–AlPcS4, F127–AlPcS4, and AlPcS4 on SGC-7901 cells. The cells were treated with 0.25–8 µg/mL AuNR–AlPcS4, Clip–AlPcS4, F127–AlPcS4, and AlPcS4 for 6 hours and incubated again for 24 hours. (D) The antiproliferation activity by AuNR–AlPcS4, Clip–AlPcS4, F127–AlPcS4, and AlPcS4 on SGC-7901 cells. The cells were treated with AuNR–AlPcS4, Clip–AlPcS4, F127–AlPcS4, and AlPcS4 at 0.5–8 µg/mL, irradiated by laser light and then incubated continuously for 12 days. After being treated, the cells were fixed with 4% paraformaldehyde, stained with crystal violet, and photographed. (E and F) The colony formation rates were quantified (+ represents irradiation; − represents no irradiation). The experiment was repeated three times. The data represent the average of three experiments and the error bars show SD. *P<0.05, represents statistical difference in colony formation rate between AlPcS4 carriers and AlPcS4. **P<0.01, represents statistically significant difference in colony formation rate between AlPcS4 carriers and AlPcS4.
Abbreviations: AlPcS4, Al(III) phthalocyanine chloride tetrasulfonic acid; CCK-8, Cell Counting kit-8; Clip, cationic liposome; RRLAC, arginine-arginine-leucine-alanine-cysteine peptide.
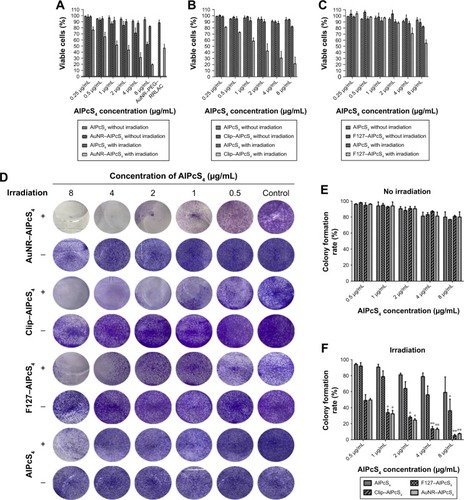
Figure 3 Evaluation of delivery efficiency of AlPcS4 carriers in SGC-7901 cells.
Notes: (A–F) Total fluorescence intensity of free AlPcS4 at 0.25–4 µg/mL in cell solution (A) and intracellular fluorescence intensity of AlPcS4 (B), F127–AlPcS4 (C), Clip–AlPcS4 (D), AuNR–AlPcS4 without irradiation by 808 nm laser light (E), and AuNR–AlPcS4 with irradiation by 808 nm laser light (F) at 0.5–8 µg/mL after treatment on SGC-7901 cells for 6 hours, respectively. (A1–F1) The correlation between concentration and fluorescence intensity of free AlPcS4 (without uptake in cells, A1), AlPcS4 (uptake in cells, B1), F127–AlPcS4 (uptake in cells, C1), Clip–AlPcS4 (uptake in cells, D1), AuNR–AlPcS4 (uptake in cells and without irradiation by 808 nm laser light, E1), and AuNR–AlPcS4 (uptake in cells with irradiation by 808 nm laser light, F1), respectively. The experiment was repeated three times. The data represent the average of three experiments and the error bars show SD.
Abbreviations: AlPcS4, Al(III) phthalocyanine chloride tetrasulfonic acid; AuNR, gold nanorods; Clip, cationic liposome.
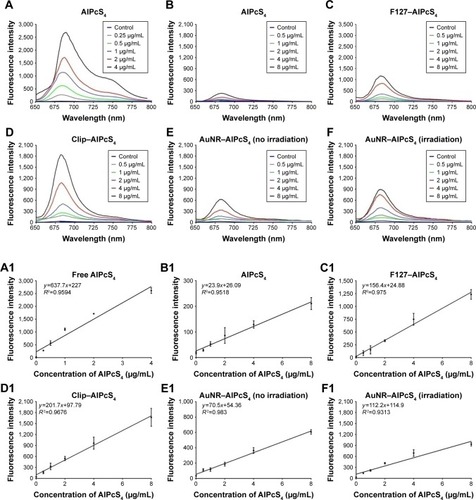
Figure 4 Fluorescence imaging of delivery efficiency of AlPcS4 carriers in SGC-7901 cells.
Notes: In vitro live cells staining with AlPcS4, Clip–AlPcS4, F127–AlPcS4, and AuNR–AlPcS4 before and after irradiation by 808 nm laser light, at 0.5–8 µg concentration, and further fluorescence location assay in SGC-7901 cells by staining with DAPI (nuclear staining) and AlPcS4 at 8 µg. Scale bars =20 µm.
Abbreviations: AlPcS4, Al(III) phthalocyanine chloride tetrasulfonic acid; AuNR, gold nanorods; Clip, cationic liposome.
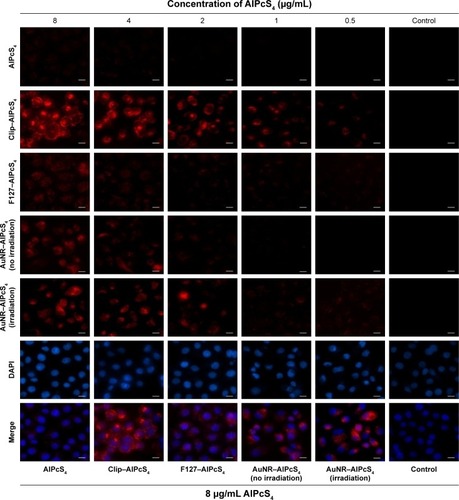
Figure 5 Inhibition effect on the binding affinity of AlPcS4 to FBS with F127, AuNR, and CliP.
Notes: Inhibition rate analysis and comparison of fluorescence intensity of AlPcS4, F127–AlPcS4, AuNR–AlPcS4, and Clip–AlPcS4 at 8 µg/mL with the presence of 10% FBS and 20% FBS in the medium. The experiment was tested in triplicate. The data represent the average of three experiments and the bar is SD.
Abbreviations: AlPcS4, Al(III) phthalocyanine chloride tetrasulfonic acid; AuNR, gold nanorods; Clip, cationic liposome; FBS, fetal bovine serum.
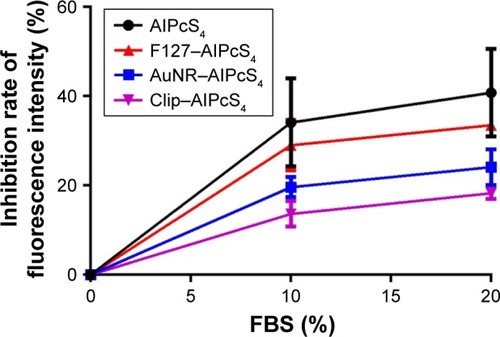
Figure 6 Apoptosis and necrosis induced by AlPcS4, F127–AlPcS4, Clip–AlPcS4, and AuNR–AlPcS4 in gastric cancer cells.
Notes: SGC-7901 cells treated with AlPcS4, F127–AlPcS4, Clip–AlPcS4, and AuNR–AlPcS4 at 0.5–8 µg/mL were irradiated, incubated for 24 hours, stained with Hoechst 33258 and PI dyes and then imaged. All the Hoechst and PI stain images were acquired at 40× magnification. Scale bars =20 µm.
Abbreviations: AlPcS4, Al(III) phthalocyanine chloride tetrasulfonic acid; AuNR, gold nanorods; Clip, cationic liposome; PI, propidium iodide.
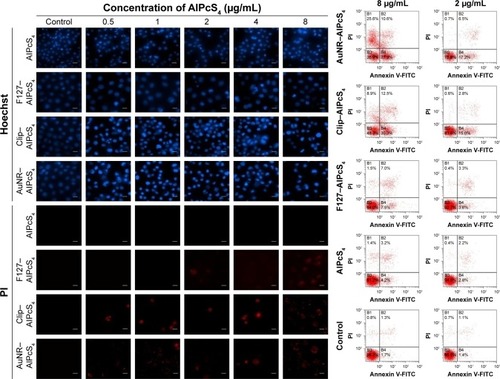
Figure 7 SOG and ROS production in SGC-7901 cells treated with AlPcS4 carriers or AlPcS4.
Notes: (A, B) The fluorescence intensity of SOSGR probe or DCFH-DA probe measured to analyze SOG and ROS production in SGC-7901 cells treated with AlPcS4, F127–AlPcS4, Clip–AlPcS4, AuNR–AlPcS4, and AuNR–PEG–RRLAC and irradiated with laser light, at different concentrations (0.5–8 µg/mL). Data represent the average of three experiments and the bar is SD. (C and D) The relative increased trend of SOG and ROS production in SGC-7901 cells treated with AlPcS4, F127–AlPcS4, Clip–AlPcS4, and AuNR–AlPcS4 and irradiation with laser light, at different concentrations (0.5–8 µg/mL).
Abbreviations: AlPcS4, Al(III) phthalocyanine chloride tetrasulfonic acid; AuNR, gold nanorods; Clip, cationic liposome; DCFH-DA, 2′,7′-Dichlorodihydrofluorescein diacetate; ROS, reactive oxygen species; RRLAC, arginine-arginine-leucine-alanine-cysteine peptide; SOG, singlet oxygen; SOSGR, singlet oxygen sensor green reagent.
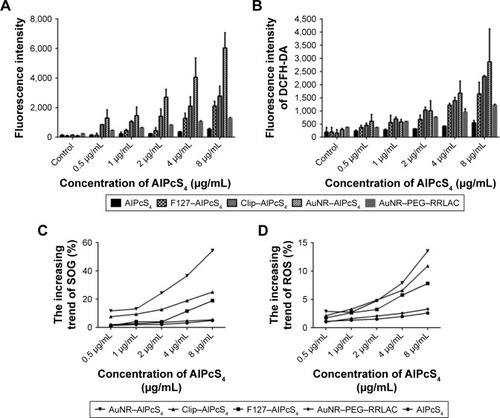
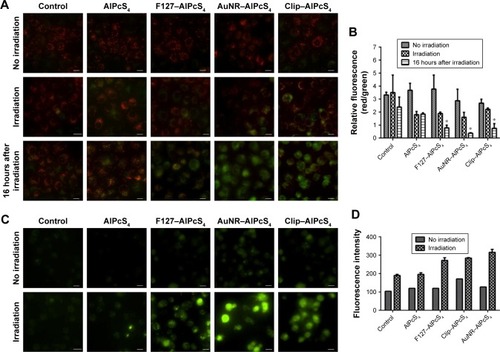
Figure 8 The loss of mitochondrial transmembrane potential (∆Ψm) and (Ca2+)i overload induced by different AlPcS4 carriers or AlPcS4 before and after PDT therapy.
Notes: (A) The ∆Ψm change in SGC-7901 cells after treatment with AlPcS4, F127–AlPcS4, AuNR–AlPcS4, and Clip–AlPcS4 at 8 µg/mL was measured by JC-1 reagent without irradiation of laser light, with irradiation of laser light, and after irradiation for 16 hours (left). Red fluorescence represents the mitochondrial aggregate form of JC-1 (JC-1 polymers), which indicates the intact mitochondrial membrane potential. Green fluorescence represents the monomeric form of JC-1 (JC-1 monomers), which indicates the dissipation mitochondrial membrane potential. (B) Ratios of JC-1 polymers to JC-1 monomers (red/green fluorescence) were assessed for no irradiation group, irradiation group, and irradiation group after 16 hours (right). (C) The fluorescence imaging of Fluo/AM probes were measured in SGC-7901 cells treated with AlPcS4, F127–AlPcS4, AuNR–AlPcS4, and Clip–AlPcS4 at 8 µg/mL before and after irradiation with laser light. (D) The corresponding fluorescence intensity assay of Fluo/AM probes was assessed for no irradiation group and irradiation group. The data represent the average of three experiments and the error bars show SD. *P<0.05, represents statistical difference between AlPcS4 carriers and AlPcS4 or control. Scale bars are 20 µm.
Abbreviations: AlPcS4, Al(III) phthalocyanine chloride tetrasulfonic acid; AuNR, gold nanorods; Clip, cationic liposome; PDT, photodynamic therapy.